
It's definitely peak hurricane season!
We're in the height of hurricane season as ContactRelief Meteorologist Dr. Kevin Levey examines Hurricane Maria, Jose, and Tropical Depression Lee.
Tuesday, 19 September 2017 11:00:00 -05:00
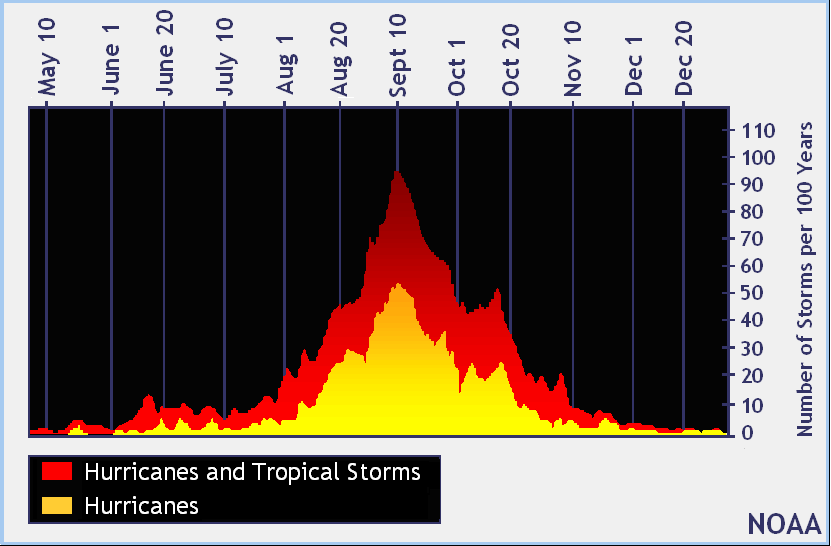
It's definitely peak hurricane season. I said this last week and I will say it again: To say the last three weeks have been busy weather-wise, would be an understatement. We’re currently right at the heart of the hurricane season as shown in Figure 1 below. September 10th marks the peak date, but in case you haven't noticed, we’re at the peak of the season.
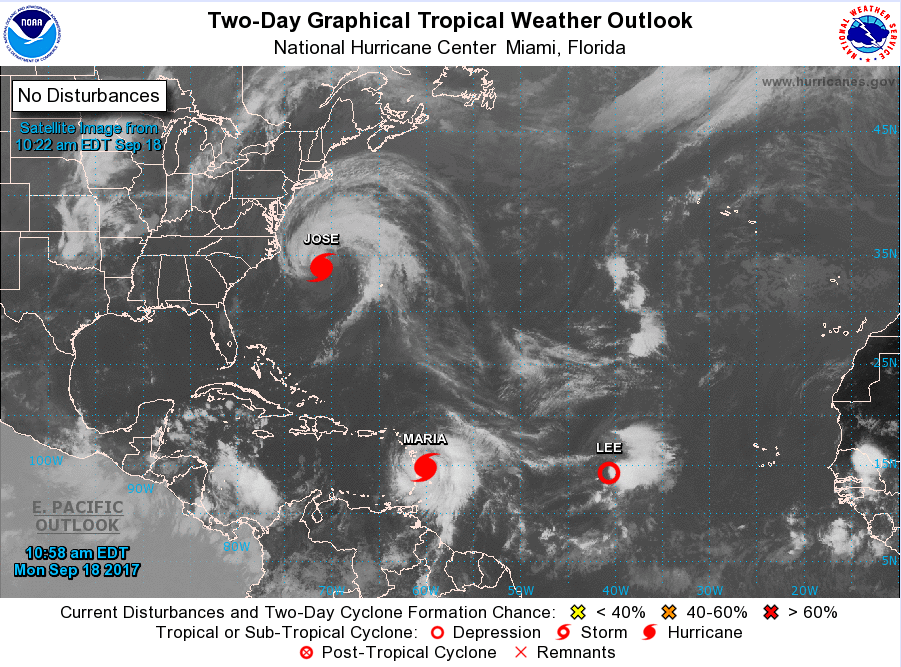
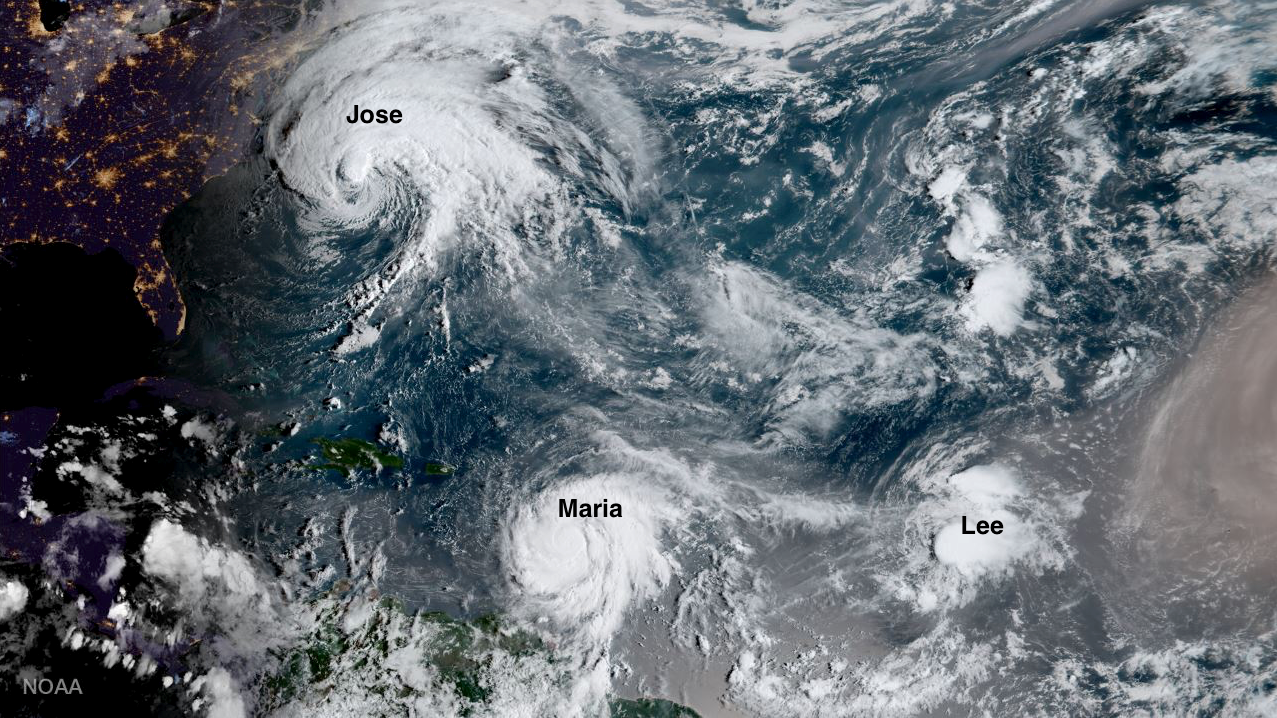
And to not disappoint, mother nature continues to churn out one tropical system after another in the Atlantic Ocean. Figures 2 and 3 below, shows the current state as of Monday, 18th September. Currently there are two hurricanes, Jose and Maria and tropical depression Lee.
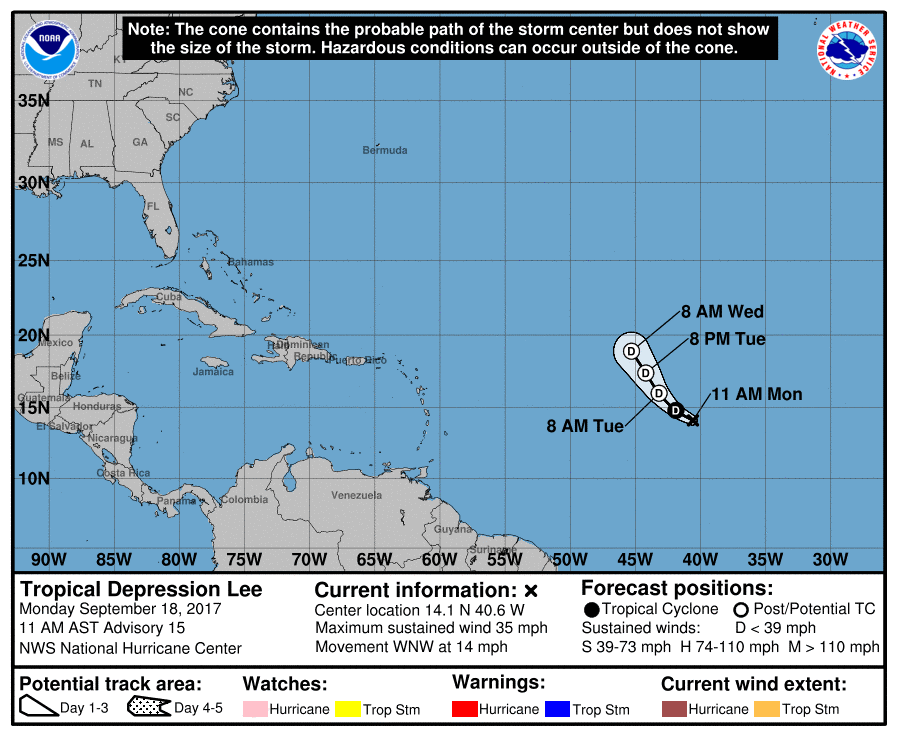
As of the 11 AM AST NHC advisory, Tropical Depression Lee poses no danger to any land areas and is expected to weaken and fade by 8 AM on WED as seen in the forecast track in Figure 4 below.
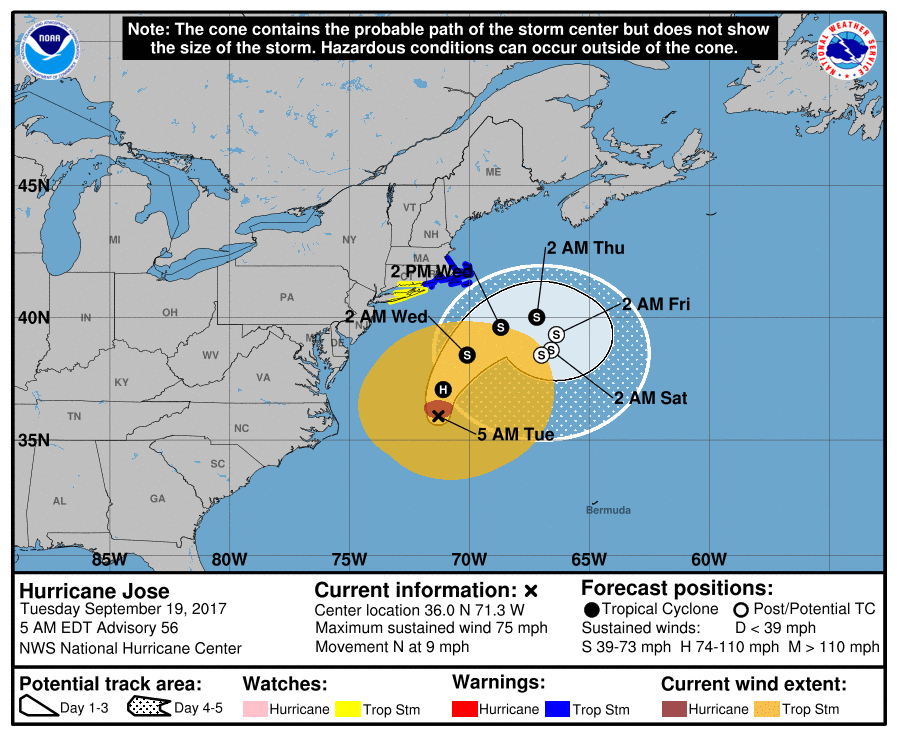
Next up is Hurricane Jose – yes, Jose is still around. Once a major Category 4 hurricane at the same time as Irma, Jose has been around since 11 AM AST Tue 5th September. Figure 5 below shows the latest NHC track forecast and advisory as of 11 AM EDT. It is currently a minimal Category 1 hurricane with sustained wind speeds of 75 mph moving north at about 9 mph and at this stage is not expected to make landfall over the North East, however, both tropical storm watches and warnings have been posted along the New Jersey coastline all the way up to Boston as a precaution. The current forecast has Jose weakening to a tropical storm by 9 AM EDT on Wednesday and then recurring southwards, which would be the second time that Jose has performed a loop on itself.
Of greater concern right now, is Hurricane Maria which formed over the weekend at 11 AM AST on Saturday, 16th. Maria intensified very rapidly, and unfortunately, as seen in Figure 6 below, became the third major hurricane in the Atlantic in less than two weeks. As of 1 PM AST, Monday 18th September, Maria was a Category 3 hurricane, located just to the east of the Leeward Islands (Martinique, to be exact) with sustained winds of 125 mph and moving WNW at around 10 mph.
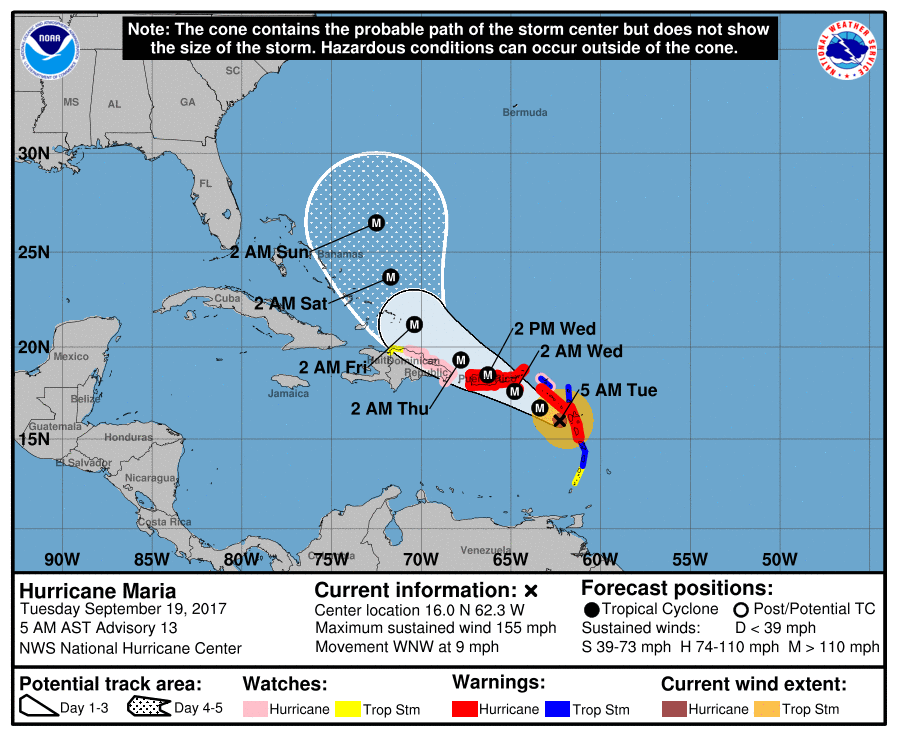
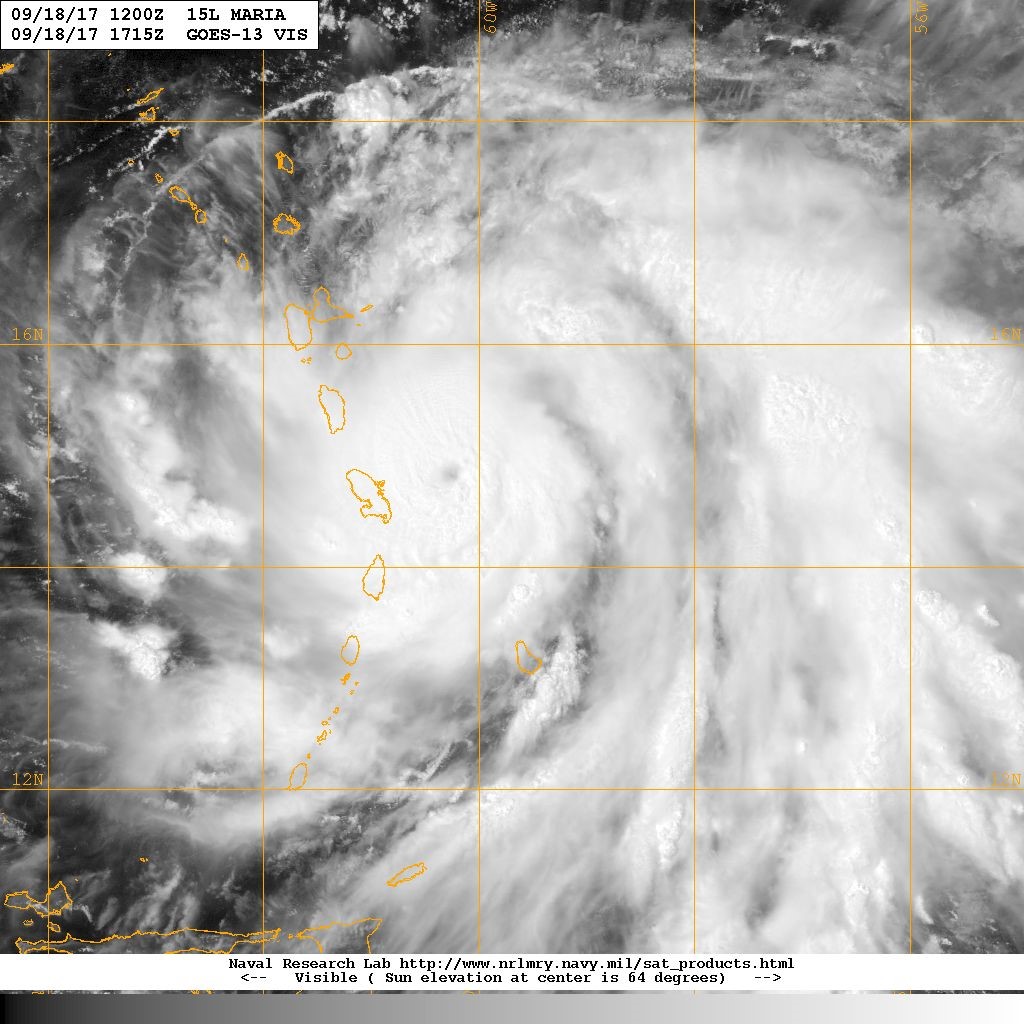
Figure 7 below, shows a visible satellite image of Hurricane Maria situated just to the east of the of Martinique. The forecast has Maria making a direct hit on Dominica, sparing Guadeloupe to the north. Tropical storm-force wind extends 125 mph outwards from the relatively small eye of 12 miles in diameter.
Maria intensified further Monday becoming the second major Category 5 storm of the season to threaten U.S. interests with winds over 160 mph. The bad news is that Puerto Rico may not be spared a direct hit like it did when it escaped a direct hit from Hurricane Irma. The bottom line is that Maria will be a very dangerous hurricane when it starts affecting the already ravaged US Virgin Islands (thanks to Irma last week) and Puerto Rico on Tuesday night and on into Wednesday.
Although it is still too early to predict if Maria will make landfall in the United States, both the American GFS (Global Forecast System) and ECMWF (European Center for Medium-Range Weather Forecasts) have Maria missing the USA based on the latest forecast, but that will likely change as each day progresses.
Figure 8 below shows the GFS ensemble forecast track solution (called a spaghetti plot) showing all 20 ensemble members forecast tracks based on the 12Z forecast run.
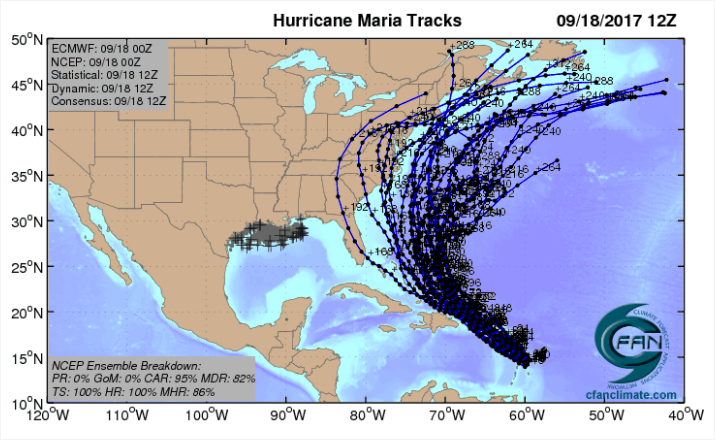
As mentioned before, the uncertainty of the actual position of the track rapidly increases after day 3 with an error of about 159 miles on day 4 and 211 miles on day 5. As we get closer to the weekend, we will have a better idea of where Maria is likely to track. Let’s hope that she takes a northward track as the US certainly does not need to have a third major land falling hurricane within five weeks.