Storm of the Century
Meteorologist Dr. Kevin Levey examines the Storm of the Century.
Tuesday, 13 March 2018 07:00:00 -05:00
Yesterday marks the start of what quickly became the most massive and disruptive middle-latitude cyclonic storm in the United States. No, I am not talking about today's Nor'easter, the third Nor'easter in 11 days to hit the US, but rather a storm that hit some 25 years ago! The superstorm of March 1993 is also known as the “Storm of the Century”. The storm is remembered for extreme high winds all along the East coast, extreme coastal flooding along the Florida west coast, incredibly low barometric pressures across the Southeast and Mid-Atlantic, its tremendous snowfall totals from Alabama through Maine and for the unseasonably cold air that followed behind the storm. To quote the National Weather Service: "In terms of human impact, the Superstorm of 1993 was more significant than most land-falling hurricanes or tornado outbreaks and ranks among the deadliest and most costly weather events of the 20th century."
Figure 1 below shows the development of the ferocious mid-latitude cyclonic storm of March 1993. A small wave in the western Gulf of Mexico intensi?ed into a deep open-wave (Mid-Latitude) cyclone over Florida. It moved northeastward and became strongest over Virginia where its central pressure dropped to 960mb (28.35”). As the storm continued on its northeastward movement, it gradually weakened and dissipated later on the 14 th March 1993.
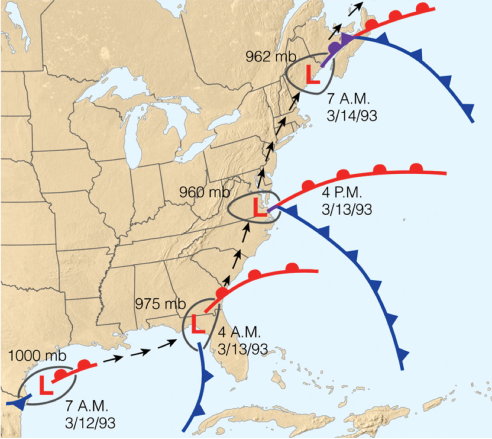
Figure 2 below shows the enhanced satellite image as the surface low was still rapidly deepening in the Gulf of Mexico at 2AM EST on March 13 th 1993. At this point, it was already affecting the entire East coast from Miami, Florida to Portland, Maine.
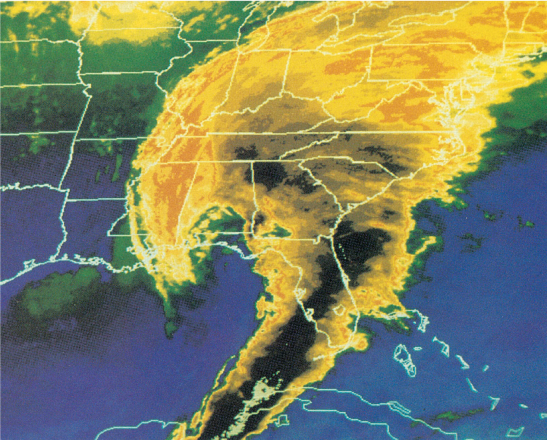
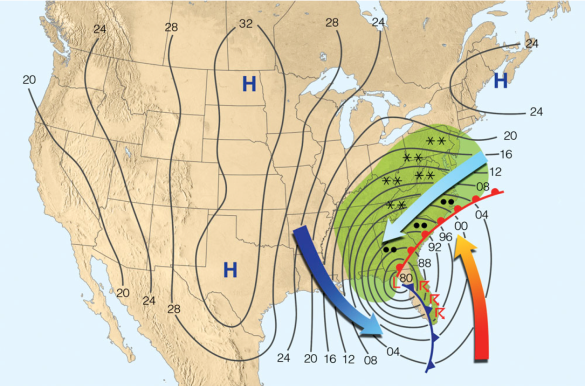
Figure 3 below, shows the surface weather conditions 2 hours later at 4AM PST 13 th March.
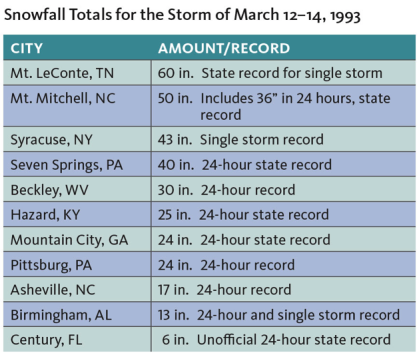
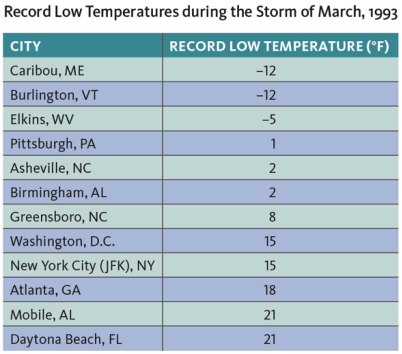
Tables 1 and 2 below show some of the extreme records that were broken all over the eastern seaboard during the 12-14 th March 1993 “Storm of the Century”.