
Where did Spring go?
Meteorologist Dr. Kevin Levey looks at the hot temps in May
Wednesday, 20 June 2018 05:30:00 -05:00
No, you didn't’ imagine it, May was warm across the United States. Actually, it was “on fire” meteorologically speaking. Hot on the heels of one of the coldest Aprils in US history, May did an amazing turnaround on the temperatures. It was the warmest May for the contiguous United States in records dating back to 1895 with a whopping +5.1°F above the 20th-century average. To put things in perspective, May 2018 beats our the Dust Bowl month of May in 1934 which was 4.5°F above the 20th-century average. What is even more startling is that this is the third time in the last three years that a longtime monthly U.S. heat record has been broken: December 2015 beat a 1939 record and June 2016 broke the previous record set in 1933. Figure2 below shows the Monthly average temperature for May sine 1895.
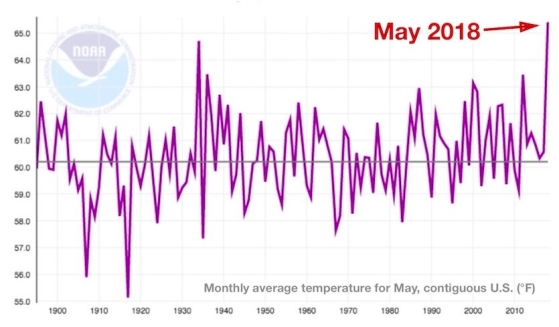
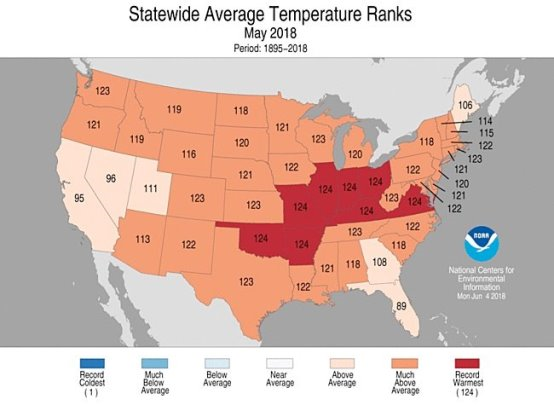
If we look at Figure 2 below, we can see that the warmth around the country was very well distributed. Every one of the Lower 48 states came in well above average for May, which is quite a rare feat since a warm West usually goes hand in hand with a cold East and vice versa. A total of 41 states had a top-ten-warmest May, and eight of those states had a record-warm May: Arkansas, Illinois, Indiana, Kentucky, Missouri, Ohio, Oklahoma, and West Virginia. The Oklahoma record is especially impressive given that western Oklahoma was near the epicenter of the devastating 1930s Dust Bowl.
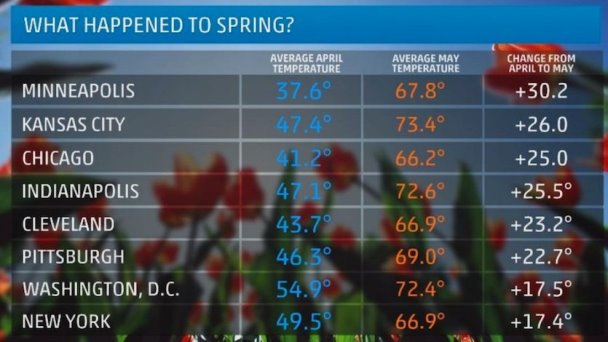
Upper Mid-West residents were on the temperature roller coaster, going from cold, wintery conditions, by-passing spring and jumping directly into summer with triple-digit temperatures (100°F) in Minneapolis on the 27th May. To exacerbate the situation, the Twin Cities hit the 90°F mark on six consecutive days which also beat the previous record of four consecutive days. Even down in Texas is was hot by Texan standards. Lubbock not only endured its hottest May on record but reached the 100°F mark on eight days, beating the old May record of six days. Figure 3 below shows the wild temperatures swings from cold and below average temperatures in April to well above average temperatures in May.
Dozens of other U.S. cities and towns had their warmest May on record. This includes at least 11 state capitals, all with more than a century of weather data under their belts:
Austin, TX(80.6°F, tied with May 1996, records begin 1898)
Atlanta, GA (74.8°F, tied with May 1996, records begin 1880)
Charleston, WV(72.0°F, old records 71.7°F in 1991, records begin 1892)
Columbus, OH(71.7°F, old record 70.8°F in 1991, records begin 1879)
Indianapolis, IN(72.6°F, old record 70.7°F in 1896, records begin 1871)
Lansing, MI(64.7°F, tied with May 1881, records begin 1863)
Little Rock, AR(76.4°F, old record 76.3°F in 1987, records begin 1880)
Raleigh, NC(74.2°F, old records 73.9°F in 1896, records begin 1887)
Richmond, VA(73.4°F, old record 73.0°F in 2004, records begin 1897)
Springfield, IL(74.5°F, old records 72.3°F in 1962, records begin 1880)
Topeka, KS(74.7°F, old record 72.7°F, records begin 1888)
So, yes, you didn’t imagining it. It was hot in May. About the only place with near normal temperatures in May in the USA was in the San Francisco Bay area where downtown San Francisco was a measly 0.1°F above the May average of 59.0°F.
Weekly Outlook:
Here is what to expect regarding precipitation and temperature in the coming week.
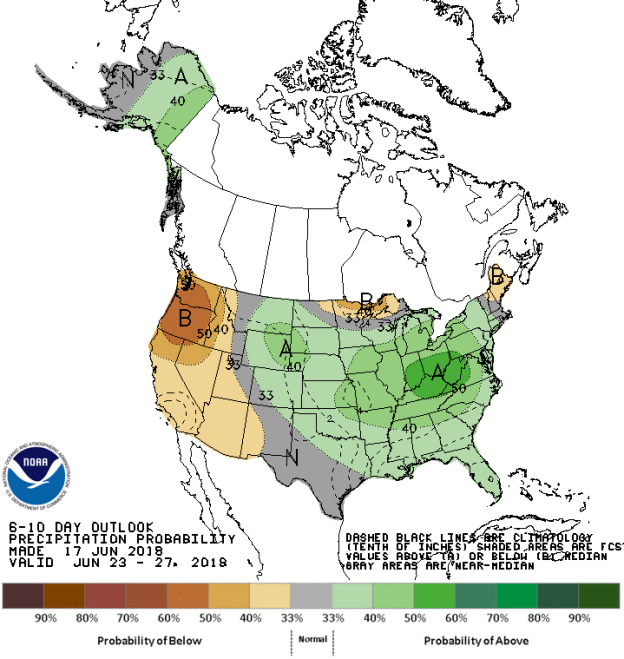
Figures 4 and 5 below show the expected 6-10-day temperature and precipitation outlooks. The colored shading on the map indicates the degree of confidence the forecaster has in the category indicated, where "B" and blue colors indicate "below-normal" and "A" and orange-red colors indicate "above normal". The darker the shading, the greater is the level of confidence. The numbers labeling the contours separating different shades gives the probability that the indicated category (A, B, or N) will occur.
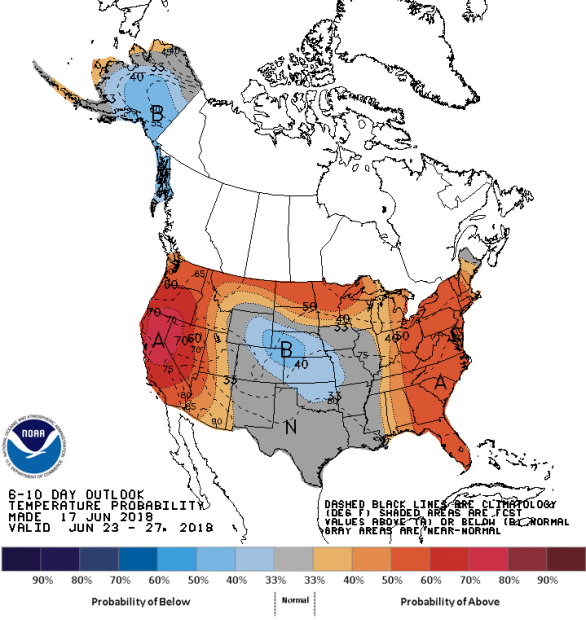
After a few weeks of very hot conditions over the central parts of the country, changes are in store for the upcoming period, with the emphasis of the greatest heat shifting westwards and eastwards, leaving the central parts of the U.S. mostly with average to slightly below average temperatures for this time of the year. Generally, the probability of below average temperatures (as seen in Figure 4) is low over Nebraska, Kansas and northern Oklahoma and eastern Wyoming. The probability is high that temperatures will be above average from the Pacific Northwest, southwards to California, including other western states of Idaho, Utah, Nevada and Arizona. The Northern Tier states from Montana to the Midwest should also see low to moderate chances of temperatures being above average. The eastern third of the country east of the Mississippi River from Florida to New England has a moderate chance of experiencing above average temperatures. Much of Texas, New Mexico, Colorado and eastern parts of the Central Plains states should experience normal temperature for this time of the year.
The precipitation outlook for the next 6-10 days (Figure 5) shows the probabilities are moderate to high for below average rainfall over much the Pacific Northwest, with lower probabilities over California, Nevada, western Utah, Idaho and Arizona as well as the far northern Midwest regions of Minnesota and Wisconsin. Low probabilities also exist for below average rainfall over much of Maine. The highest probabilities for above average rainfall exists over most of central Plains states and the eastern parts of the country, centered on the Ohio Valley. Most of southwestern Texas should experience average rainfall for this time of the year.
Weekly hazards output by the NWS’s Climate prediction center for the next 3-7 days is shown in Figure 6 below.
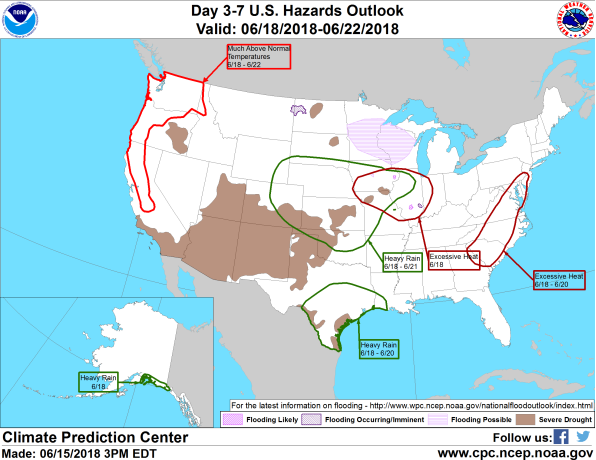
Figure 6 shows that most of the expected weather hazards over the United States in the next 3 to 7 days. Heavy rain are southern Alaska on the 18th June, over southern Texas between the 18th and 20th June and over much of the central part of the country including western Colorado, Nebraska, Iowa, Kansas, northwestern Missouri and northern Oklahoma (the same areas expected to experience below average temperatures) between the 18th and 21st June. Much above normal temperatures can also be expected between 18th and 22th June over a large part of the Pacific Northwest, including all of Washington, western Oregon and much of central Northern and Central California. Excessive heat is expected over much of southern Iowa, northern Missouri and Illinois on the 18th June and between the 18th and 20th from South Carolina northwards through North Carolina, Virginia, eastern Maryland, southeastern Pennsylvania and New Jersey.
Are you prepared for the next disaster?
Disasters can strike at a moment’s notice. That’s why, at ContactRelief, we provide round the clock disaster monitoring to keep your operations ahead of disasters. With timely, comprehensive recommendations that are accurate to the ZIP code, ContactRelief ensures you focus less on the disaster, and more on your operations.
Contact sales@contactrelief.com for more information.