Eye opening hurricane research!
Meteorologist Dr. Kevin Levey looks at the latest research into the eye of a hurricane
Monday, 02 July 2018 12:35:00 -05:00
Hurricane Eye Climatology and why it matters!
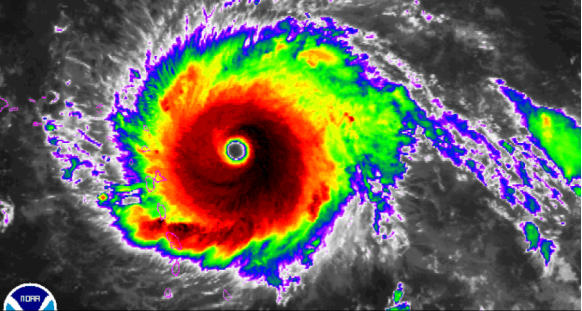
I came across this very interesting article and thought I would share it seeing we are in hurricane season. I think we are all well aware that hurricanes are one of the most dangerous weather phenomena on Earth. Ironically, at the center of these cyclones lies an area of clear skies and calm winds called the eye – almost a paradox. To recap from previous blogs, the eye is surrounded by the eyewall, which is composed of towering cumulonimbus (thunder) clouds, intense severe weather, and the storm’s strongest winds. The more defined a hurricane’s eye and eyewall, the greater the intensity of the storm. So, determining when, where, and how often eyes occur is imperative for understanding how these storms are changing over time.
Hurricane researchers set out to determine how often eyes occur, where they occur most frequently, and how their size varies. A global climatology of tropical cyclone eyes was developed based on 34 years of climatology. So what can climatology of tropical cyclone eyes tell us?
A lot of work went into producing this 34-year climatology. Not to bore you with the finer details, scientists used a computer algorithm to examine over a quarter million individual infrared satellite images and essentially helped the scientists identify the probability of an eye being present and allowed them to calculate easily:
- The location of the low pressure center
- The probability that a given image has an eye
- The width of the eye and eyewall clouds
- The percent of the eye that the eyewall encompasses
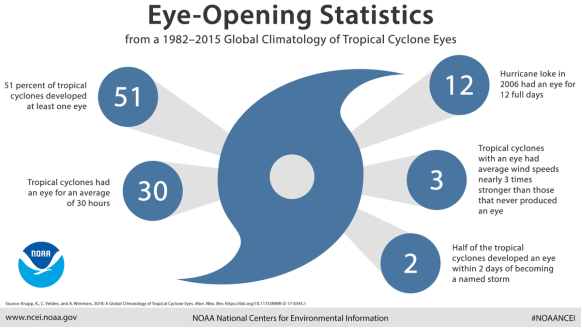
This 34-year climatology showed that more than half of the tropical cyclones occurring between 1982 and 2015 developed at least one eye. On average, the eye storms had an eye for at least 30 hours, and 50 percent of the systems developed their first eye within two days of becoming a named storm. Hurricane Loke in 2006 had an eye for the longest period of time at 12 complete days. And, storms with an eye had average wind speeds nearly three times stronger than those that never produced an eye.
Tropical cyclone eyes were much more frequent in the Northern Hemisphere, but eyes in the Southern Hemisphere were typically larger than their northern counterparts. Eyes were seen in approximately:
- 66 percent of Western Pacific storms
- 52 percent of Eastern Pacific storms
- 46 percent of Northern Indian Ocean storms
- 43 percent of Southern Indian Ocean storms
- 41 percent of North Atlantic storms
- 40 percent of Southern Pacific storms
The climatology also showed that the areas where eyes occur have been expanding toward the poles, which confirms previous research. This expansion is putting new areas and populations at risk for the devastating impacts of these storms.
Tropical Outlook:
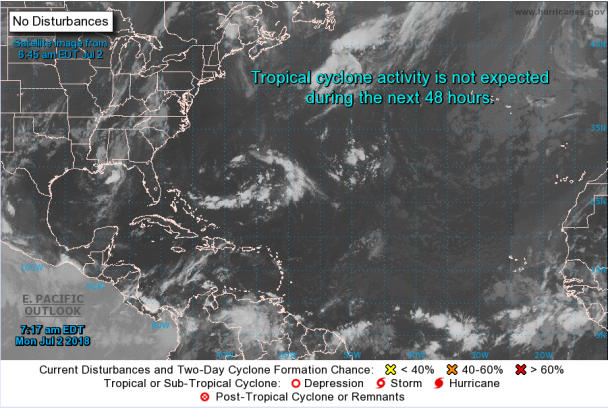
The Atlantic continues to be rather quiet (as seen in Figure 3 below) with no named storms in June, which is the first time since 2014, with no immediate development expected. Fortunately for the Gulf Coast, hostile conditions for hurricane development will prevent the current area of thunderstorms in the central Gulf of Mexico from developing any further over the next few days as it drifts westward along the coastline. No other notable tropical disturbances are forecast to develop in or enter the Gulf of Mexico for the remainder of the week. Looking outside of the Gulf, no tropical development is expected to occur anywhere in the Atlantic Ocean over the next seven days.
Weekly Outlook:
Here is what to expect regarding precipitation and temperature in the coming week.
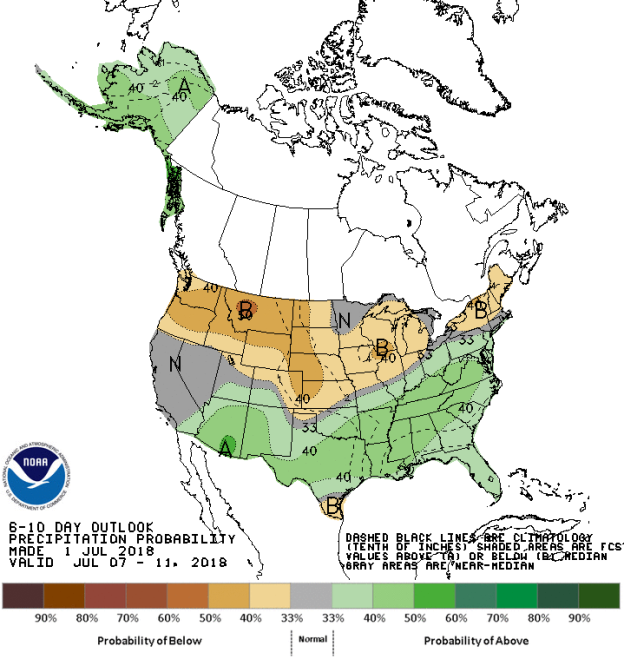
Figures 4 and 5 below show the expected 6-10-day temperature and precipitation outlooks. The colored shading on the map indicates the degree of confidence the forecaster has in the category indicated, where "B" and blue colors indicate "below-normal" and "A" and orange-red colors indicate "above normal". The darker the shading, the greater is the level of confidence. The numbers labeling the contours separating different shades gives the probability that the indicated category (A, B, or N) will occur.
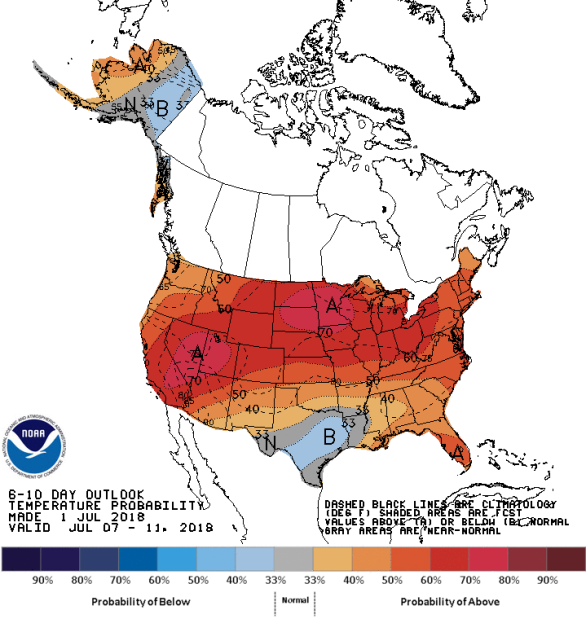
Generally, the probability of below average temperatures (as seen in Figure 4) is rather low over the south-central areas of Texas and the eastern third of Alaska. In general, the probability is moderate to high that the remainder of the country will experience above average temperatures, especially over Nevada, Colorado, the eastern parts of both North and south Dakota and much of Minnesota. Few areas in Texas and the northern half of Louisiana should experience normal temperature for this time of the year.
The precipitation outlook for the next 6-10 days (Figure 5) shows the probabilities are low to moderate for below average rainfall over much of the northern areas of the United States, from the Pacific Northwest, eastwards into New England – generally the same areas with moderate to high probabilities of expecting above average temperatures. Moderate probabilities for above average rainfall exists over most of Alaska, Arizona, New Mexico, Texas and much of the Deep South, Florida, stretching northwards into the Tennessee Valley and the Mid-Atlantic states. Most of California, Nevada and northern Minnesota should experience average rainfall for this time of the year.
Weekly hazards output by the NWS’s Climate prediction center for the next 3-7 days is shown in Figure 6 below.
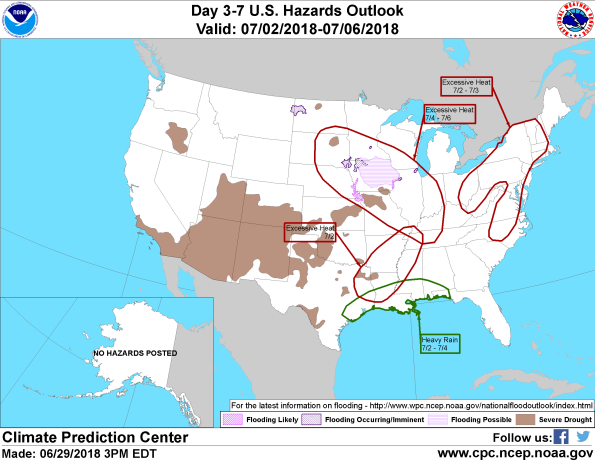
Figure 6 shows that most of the expected weather hazards over the United States in the next 3 to 7 days. Heavy rains are expected over the coastal areas of Gulf Coast states from southeastern Texas eastwards into the panhandle of Florida between the 2nd and 4th July. Much above normal temperatures can also be expected on the 2nd July over the southern Mississippi River Valley, between the 2nd and 3rd over much of New England and parts of the Mid-Atlantic and over large areas of the southern Midwest, including eastern Nebraska, south Dakota, southern Minnesota and Wisconsin, Illinois, Indiana and northern Missouri between the 4th and 6th July.
Get in touch
Shaping your outbound contact away from disaster stricken areas isn't just the right thing to do, it's smart business. To learn more about how ContactRelief can help you protect your brand, reduce your risk of adverse actions, and improve your contact center efficiency, click below to contact us.
Contact us