November's Extremes - From Wildfires to Near Record Cold
Meteorologist Dr. Kevin Levey assesses the weather extremes of November 2018
Tuesday, 11 December 2018 06:00:00 -05:00
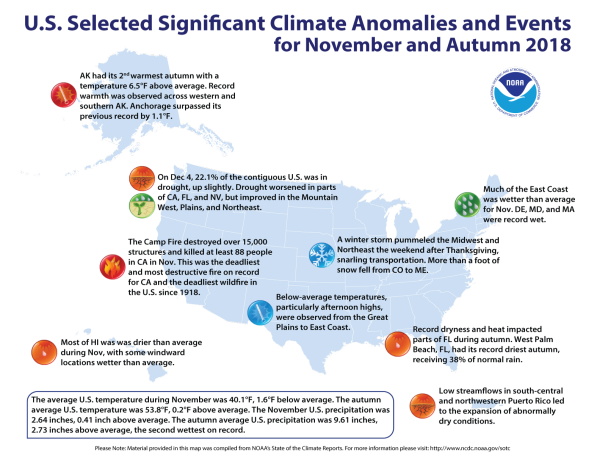
The contiguous United States had a cooler and wetter than average November. November 2018 was particular active as Figure 1 (below) shows. Record heat in Alaska, record dryness in Florida and deadly wildfires in California. These and other events of note during November 2018 will be discussed below.
November Extremes
Two large and devastating wildfires impacted California in early November when high winds interacted with long-term dryness and above-average temperatures creating ideal fire conditions. The Camp Fire burned more than 153,000 acres in Northern California, near Chico. The fire destroyed more than 18,000 structures and caused at least 88 fatalities with the town of Paradise being the hardest hit. This marked the most destructive and deadliest wildfire on record in California, and the deadliest wildfire in the U.S. since the Cloquet Fire in 1918 killed 453 people in Minnesota. The Woolsey Fire destroyed more than 1,500 structures and caused at least three fatalities in and around Malibu.
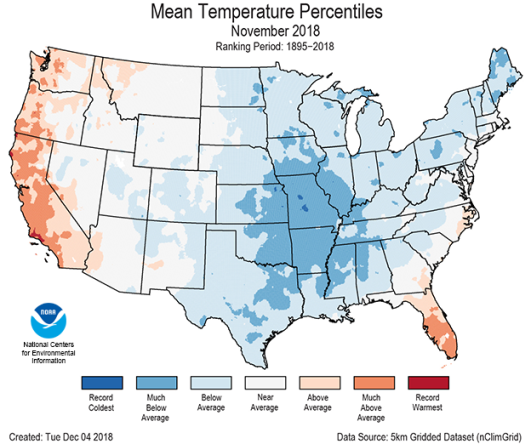
For November, the average contiguous U.S. temperature was 40.1°F, 1.6°F below the 20th-century average, ranking in the coolest third of the historical record. Below-average temperatures stretched from the Great Plains to the East Coast, with above-average temperatures along the West Coast and in Florida. During meteorological autumn (September–November), the average temperature was 53.8°F, 0.2°F above average, ranking near the middle value in the 124-year period of record. For the year-to-date, the contiguous U.S. temperature was 55.2°F, 1.4°F above the 20th century average and was the 16th warmest January–November on record. This was the coolest January–November since 2014. Figure 2 (below) shows the mean temperature percentiles for November 2018 and what is obvious from that figure are the following:
- Below-average temperatures impacted most locations from the Great Plains to East Coast with much-below-average temperatures in the Midwest to the south-central United States. Some locations observed their coldest November on record, including Kansas City, Missouri. The city’s average temperature was 35.6°F, 8.0°F below the 1981-2010 normal. There is reliable data for Kansas City dating back to 1888. On a statewide level, Arkansas, Illinois, Mississippi, Missouri and Oklahoma each had a top 10 cold November.
- Afternoon high temperatures were much colder than average for most locations east of the Rockies with 17 states having a November maximum temperature that ranked among the 10 coldest. Averaged across the entire contiguous U.S., the maximum temperature was 50.3°F, 2.4°F below average. This was the coldest maximum temperature departure from average for any month since November 2014.
- Alaska had its seventh warmest November on record with an average temperature of 19.3°F, 7.6°F above average. Much-above average temperatures were observed across western and southern parts of the state. Much-below-average sea ice was also observed off Alaska’s west coast in the Bering Sea.
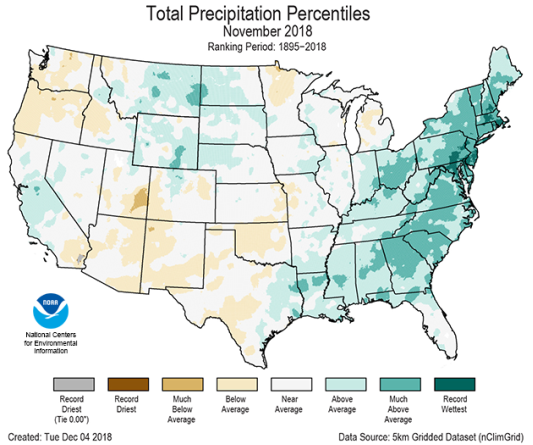
The November precipitation total for the contiguous U.S. was 2.64”, 0.41” above average, and ranked in the wettest third of the 124-year period of record. Much-above-average precipitation accumulated in the East, with record totals in parts of the Mid-Atlantic and Northeast. Below-average precipitation fell in the Northwest, Southwest, and parts of the Southern Plains. The autumn precipitation total for the contiguous U.S. was 9.61”, 2.73” above average. This was the second wettest autumn on record, behind the 9.72” that fell in 1985. For the year-to-date, the national precipitation total was 31.31”, 3.72” above average. This marked the fifth wettest January–November on record and wettest since 1998.(see Figure 3 below).
- Above-average precipitation fell across the East, Northern Plains and parts of California. The majority of the precipitation in California fell late in the month assisting wildfire containment efforts. In the East, Delaware, Maryland and Massachusetts were each record wet with 13 additional states having monthly precipitation totals that ranked among the 10 highest on record.
- According to the December 4 U.S. Drought Monitor report, 22.1 percent of the contiguous U.S. was in drought, up slightly since late October. Drought conditions improved across parts of the Mountain West, Great Plains, and Northeast. Drought conditions worsened in parts of California, the Great Basin and in Florida. Severe drought continued to impact the Alaskan Panhandle and abnormally dry conditions expanded in Puerto Rico and Hawaii.
Weekly Outlook:
Here is what to expect regarding precipitation and temperature in the coming week.
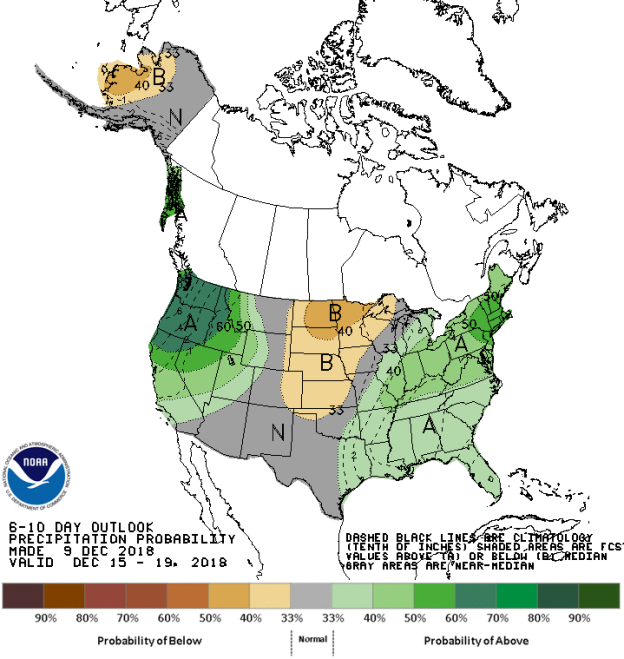
Figures 4 and 5 below show the expected 6-10-day temperature and precipitation outlooks. The colored shading on the map indicates the degree of confidence the forecaster has in the category indicated, where "B" and blue colors indicate "below-normal" and "A" and orange-red colors indicate "above normal". The darker the shading, the greater is the level of confidence. The numbers labeling the contours separating different shades gives the probability that the indicated category (A, B, or N) will occur.
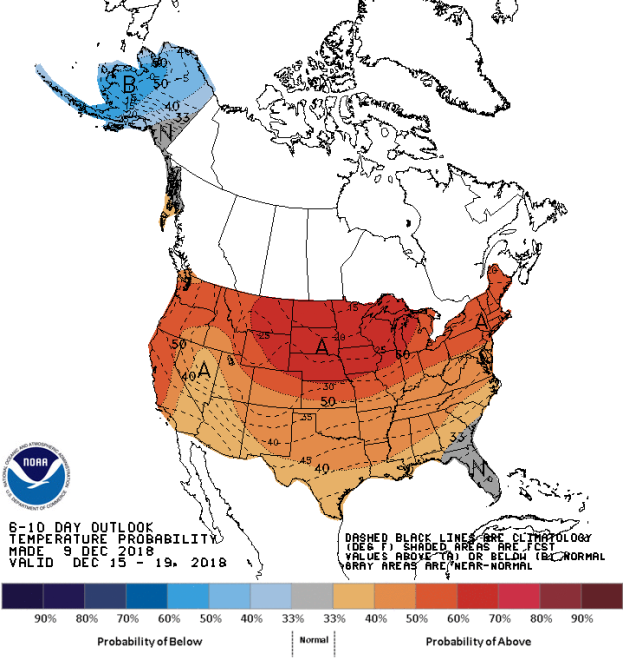
Generally, the probability of below average temperatures (as seen in Figure 5) is generally moderate over Alaska only. In general, the probability is low to moderate that with the exception of Florida, the entire United States will experience above average temperatures, especially over the Northern Tier States. Florida will experience normal temperature for this time of the year.
The precipitation outlook for the next 6-10 days (Figure 6) shows moderate probability of below average precipitation western Alaska and over much of the central and northern Plains States into Minnesota and northern Wisconsin. A low to moderate chance for above average rainfall exists for much of the eastern third of the country from Florida into New England. The probability is over 60% that above average rainfall will occur over all of the Pacific Northwest and much of the West coast with slightly lower probabilities. Most of Texas, New Mexico, Arizona, Colorado and the central areas of Montana and Wyoming should expect to receive average rainfall.
Weekly hazards output by the NWS’s Climate prediction center for the next 3-7 days is shown in Figure 6 below.
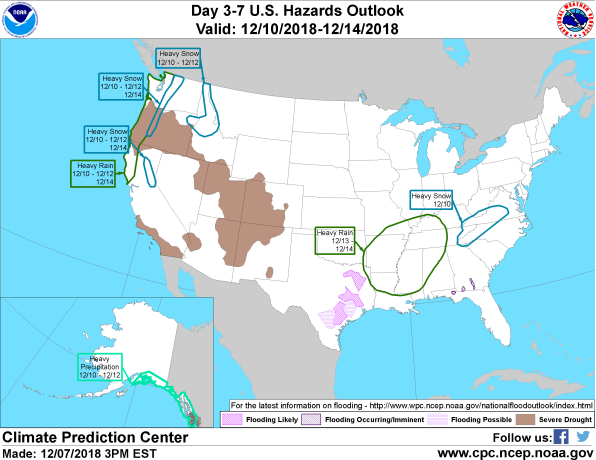
Figure 6 shows a mostly quiet period ahead in the next 3 to 7 days. Heavy precipitation is expected over the southern and southeastern areas of Alaska between the 10th and 12th December. Heavy rain is expected over much of the northern coast areas of California northwards into the Pacific Northwest coastal areas between the 10th and 12th December and again on the 14th December. Heavy rain is expected over the much of northern Louisiana, Arkansas, Mississippi, northwestern Alabama and the western half of Tennessee and southwestern Kentucky between the 13th and 14th December. Heavy snow is expected over the western areas of North Carl9na and southwestern Virginia on the 10th December. Heavy snow is expected over much of northern Idaho between the 10th and 12th December, over the northern sierras on the 10th and again between the 12th and 14th December and also over the Cascades on the 10th and again between the 12th and 14th December.
Are you prepared for the next disaster?
Disasters can strike at a moment’s notice. That’s why, at ContactRelief, we provide round the clock disaster monitoring to keep your operations ahead of disasters. With timely, comprehensive recommendations that are accurate to the ZIP code, ContactRelief ensures you focus less on the disaster, and more on your operations.
Contact sales@contactrelief.com for more information.