
Hurricanes By the Numbers
ContactRelief Meteorologist Dr. Kevin Levey assesses the 2017 hurricane forecast.
Tuesday, 15 August 2017 09:00:00 -05:00
Hurricanes by the numbers
In today's posting, I will discuss some facts and figures that relate to the Atlantic Hurricane season. Firstly, the Atlantic Hurricane season typically runs from June 1st until November 20th each year.
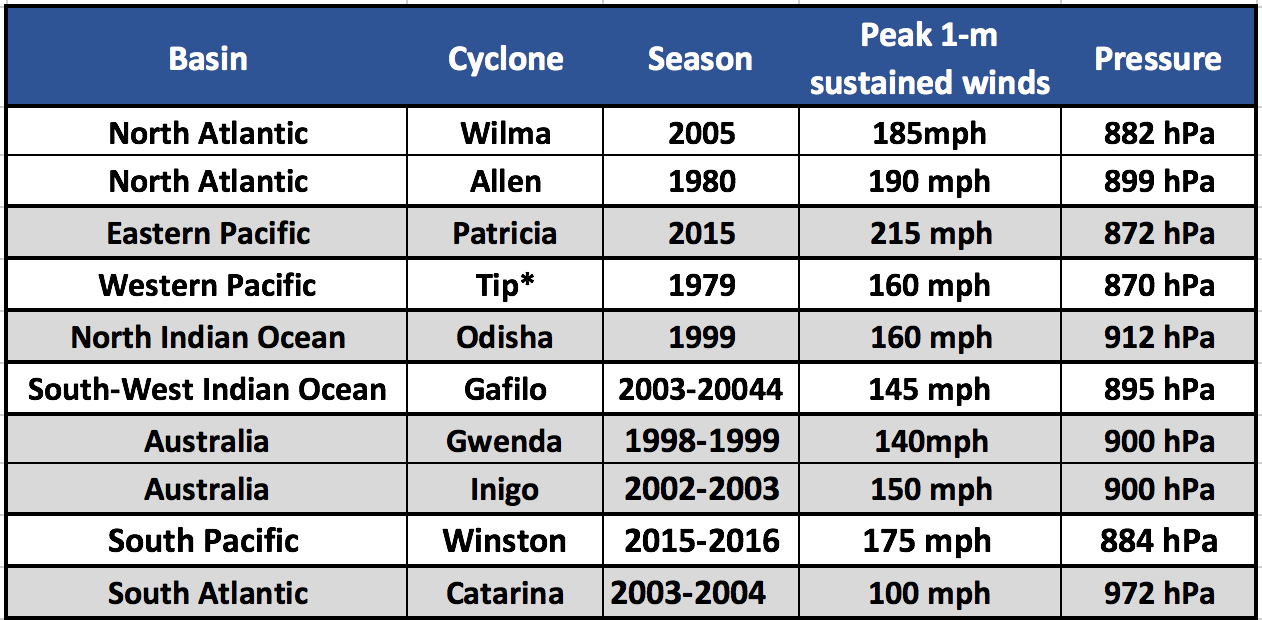
Before we discuss the Atlantic Hurricane season in more depth, let's take a step back and look at hurricanes in general. Hurricanes have an average lifespan of about 8 days. The longest-lived hurricane was Typhoon Tip that lasted a record 31 days in 1994. The average forward speed is about 14mph. Typically, hurricanes have an average diameter of about 100-120 miles, but can vary between 50 miles and 500 miles. The list below shows the strongest hurricanes ever recorded in each hurricane basins around the world:
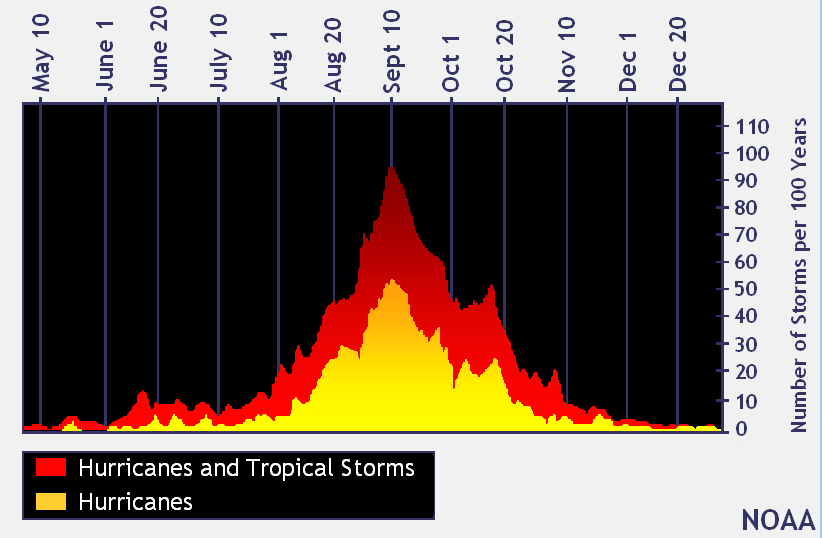
Looking only at the Atlantic Hurricane season now, Figure 2 below shows the distribution of both hurricanes and tropical storms throughout the season. The season ramps up rapidly after August 1st and the peak of the hurricane season occurs around September 10th, with a secondary peak around October 15th before rapidly waning by mid-November. The reason for this is directly related to the temperature of the ocean surface, with the warmest sea-surface temperatures occurring in September in the Atlantic Ocean, and the secondary bump in October is related to the very warm waters found in the Gulf of Mexico.
On average, there are 12 tropical storms, 6.5 hurricanes, and 2 major hurricanes each year in the Atlantic hurricane basin. The most occurred in 2005 when there were a record 27 tropical storms, 13 hurricanes and a whopping 7 major hurricanes (i.e. category three or above). It was the first time in history that every single name was used in the list and it was also the very first season ever where the following storm names were used: Beta, Gamma, Delta, Epsilon, and Zeta.
So, what does the 2017 hurricane season forebode? Colorado State University typically issues a hurricane forecast each season. This forecast is typically revised during the season. The latest was issued on August 4th, and we can see the statistics in figure 3 below:
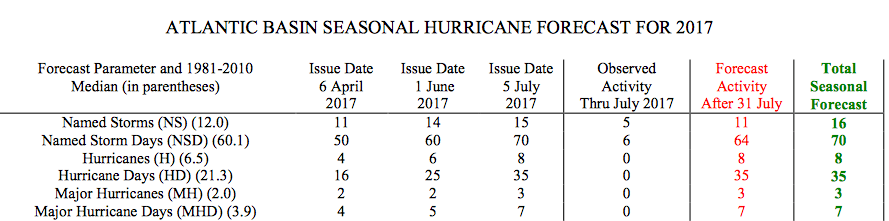
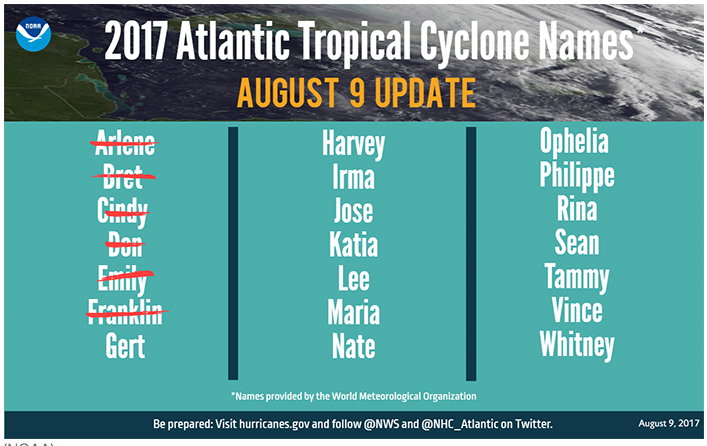
Sixteen (16) named storms, eight (8) hurricanes, and three (3) major hurricanes have been forecast. We have already had six (6) storms as shown in Figure 4 below. In fact, Tropical Storm Gert has just became Hurricane Gert. The National Hurricane Center said Tuesday morning (8/15/2017) that Gert was moving "well away from land" and was expected to pass about midway between the East Coast and Bermuda on Tuesday.
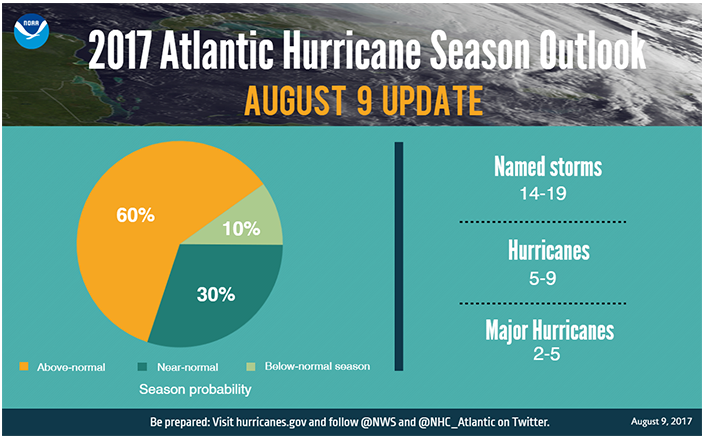
The National Hurricane Center's hurricane forecast is similar with 14-19 named storms, 5-9 hurricanes and 2-5 major hurricanes (Figure 5). We can also see that this season is expected to be an above average season with a probability of about 60% being above and only a 30% probability that it will be average. However, exactly where these forecasted storms will form and where they will track and if they will make landfall is beyond the scope of any currently existing hurricane forecast models.
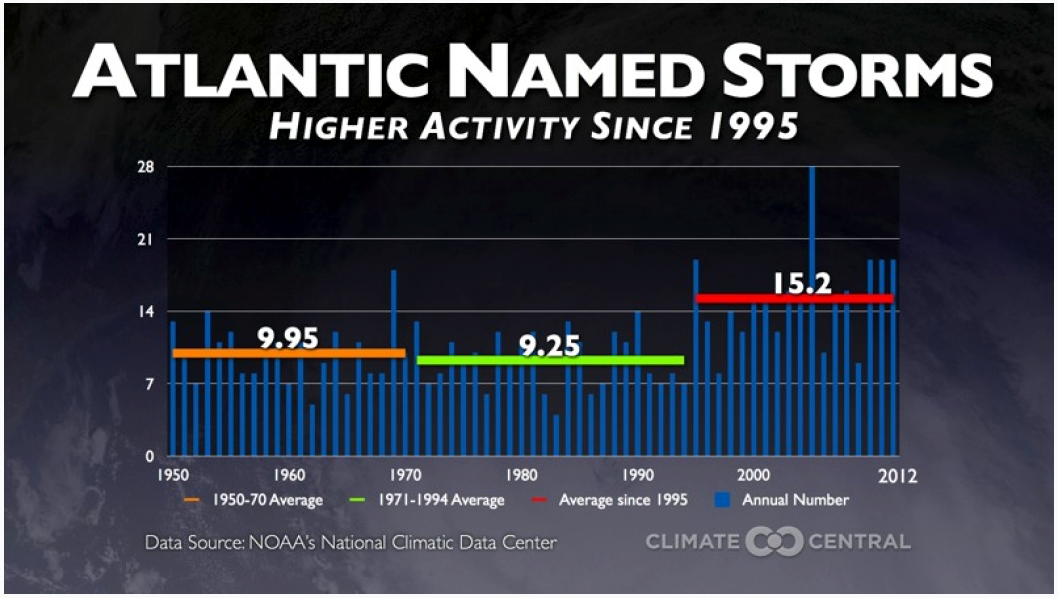
An interesting fact is that hurricane activity has increased since 1995, i.e. the frequency of named hurricanes and tropical storms. Figure 6 below shows the named storms in the Atlantic basin since 1950 and since 1995, the average has been about 15.2 storms, compared with 9.25 between 1970 and 1995. This may be due to natural climate variability and/or global warming, but there is currently no definitive evidence of either. We simply do not have a long enough archive of hurricane data so it is difficult to determine which may be true, or a combination of both.
Finally, a question I am often asked is what were the deadliest and costliest Atlantic hurricanes that have affected the United States.
The top three deadliest hurricanes in US history were:
- The 1900 Galveston Hurricane (no names storms back then) when between 8000 – 12000 people lost their lives;
- The 1928 Lake Okeechobee Hurricane (also pre-named storm era) when 1836 people lost their lives;
- Hurricane Katrina in 2005 when 1336 lost their lives.
Finally, the costliest hurricanes in US history are as follows:
- 2005: Hurricane Katrina – total cost: $75B
- 2012: Hurricane Sandy – total cost: $60B
- 1992: Hurricane Andrew – total cost: $45B
- 2011: Hurricane Irene – total cost: $13B