Want to reach up to 5 times more contacts during a disaster?
Sign up for a free trial

Harvey: The modern American Natural Disaster. (Part 1: August 17th – August 28th)
ContactRelief Meteorologist Dr. Kevin Levey examines Hurricane Harvey in this 2 part series that every risk manager and contact center professional should read.
Tuesday, 29 August 2017 07:00:00 -05:00
Since Friday August 25th, most of us have been watching a modern American disaster unfold before our eyes, not as an explosion, but as a slow-motion movie. The end result is the same. Death and destruction. And we're nowhere near the end of what is still to come. With Hurricane Katrina, we were well informed days in advance, of the impending disaster. Harvey exploded from literally the remnants of a few thunderstorms after crossing the Yucatan Peninsula of Mexico into the southern Gulf of Mexico as a weakened tropical depression. Within 72hours Harvey re-strengthened into an explosive category 4 hurricane at landfall. Typically, hurricanes that make landfall weaken rapidly and dissipate...Not Harvey. With no upper level winds to steer it away and finally to its demise, it has continued to spin on its heels and has dropped unprecedented and record breaking rainfall over the Southeastern Texas region, including the USA's 4th largest city, Houston. Let's look a little more closely at this natural disaster and how everything unfolded.
The National Hurricane Center (NHC) issued its first advisory for tropical depression Harvey at 11 AM AST on THU 17th August. Figure 1 below shows the projected path and strengthening of Harvey.
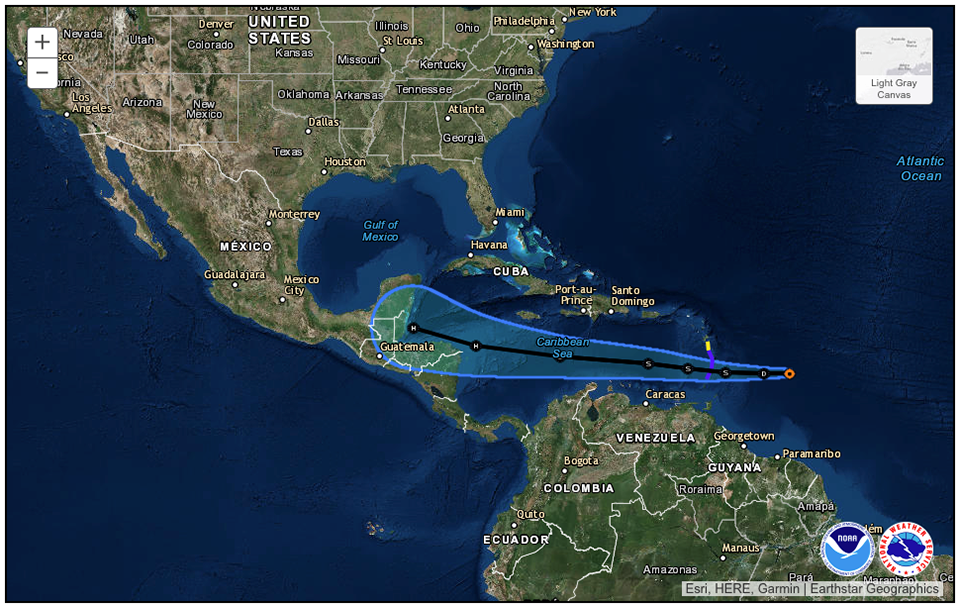
Harvey was expected to strengthen into a category 1 hurricane (sustained winds of 75mph) by 8AM AST 21st August just west of Honduras and make landfall in Belize after 8AM AST on the 22nd August. However, later advisories never had Harvey strengthening into anything stronger than a tropical storm and it had all but dissipated by Saturday, 19th August. The remnants of Harvey drifted westwards and crossed the Yucatan Peninsula and re-established itself as a tropical depression at 10AM CDT Wednesday, 23rd August. Figure 2 below shows the NHC advisory #11 for the forecast track and expected strengthening of Harvey. Take note that at that time, Harvey was not expected to strengthen into more than a tropical storm (sustained winds >34mph and < 64mph).
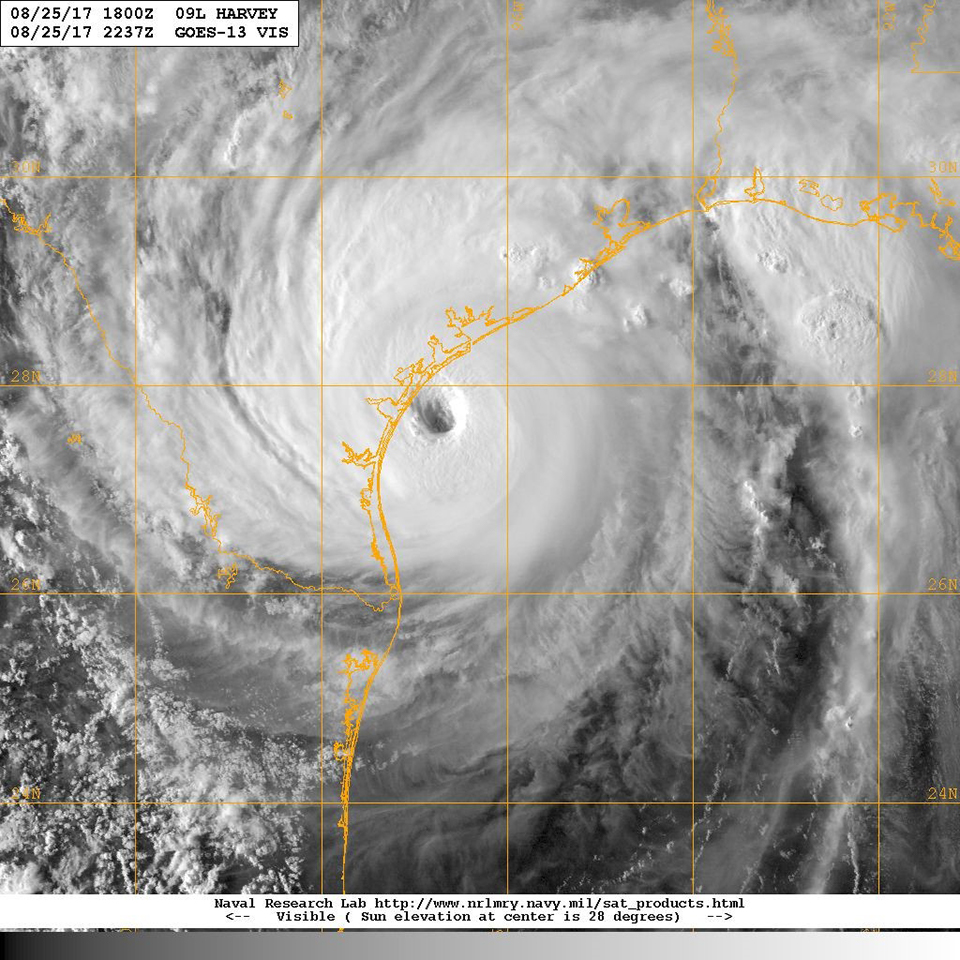
However, twelve hours later at 10PM CDT, the NHC forecast Harvey to strengthen into a category 1 hurricane by 7PM CDT on Friday 25th August. Twelve hours later at 10AM on Thursday 24th August the forecast strength of Harvey was upgraded once again to a major hurricane (sustained winds > 115mph) at 7PM on Friday 25th August located about 125miles southeast of Corpus Christie. Extremely warm sea surface temperatures and very little upper-level wind shear was enough to allow Harvey to literally explode from a weak tropical depression into a major category 3 hurricane in under 48hours and it continued strengthening right until it made landfall at around 7PM CDT on Friday 25th August with sustained winds of 130mph gusting to over 160mph between Port Aransas and Port O’Connor, Texas. Harvey is the first category 4 hurricane to make landfall in the United States since Hurricane Charlie in FL in 2004.
Figure 3 shows a visible satellite image of Harvey shortly before landfall on Fri 25th at 5:37PM CDT. The eye is clearly visible.
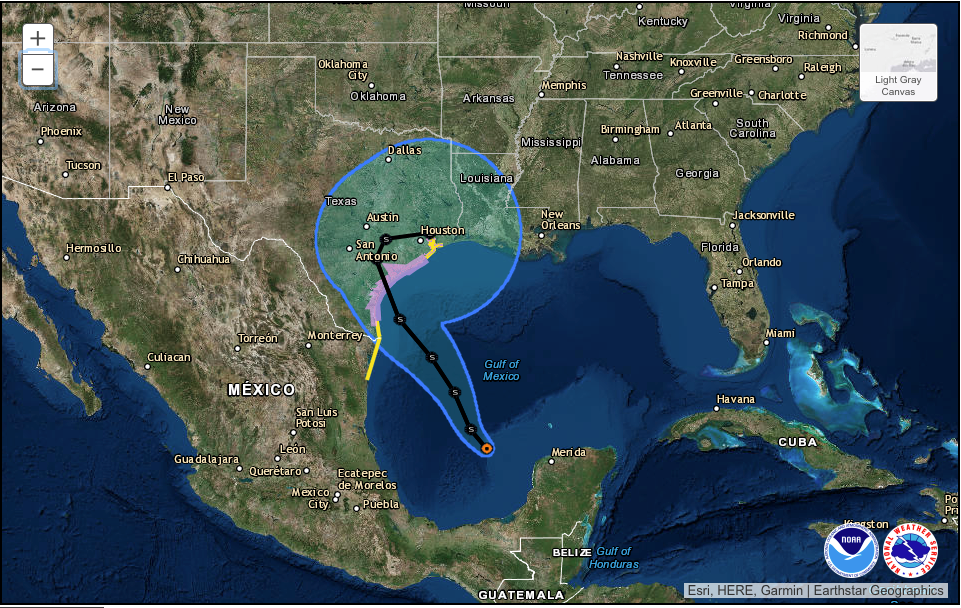
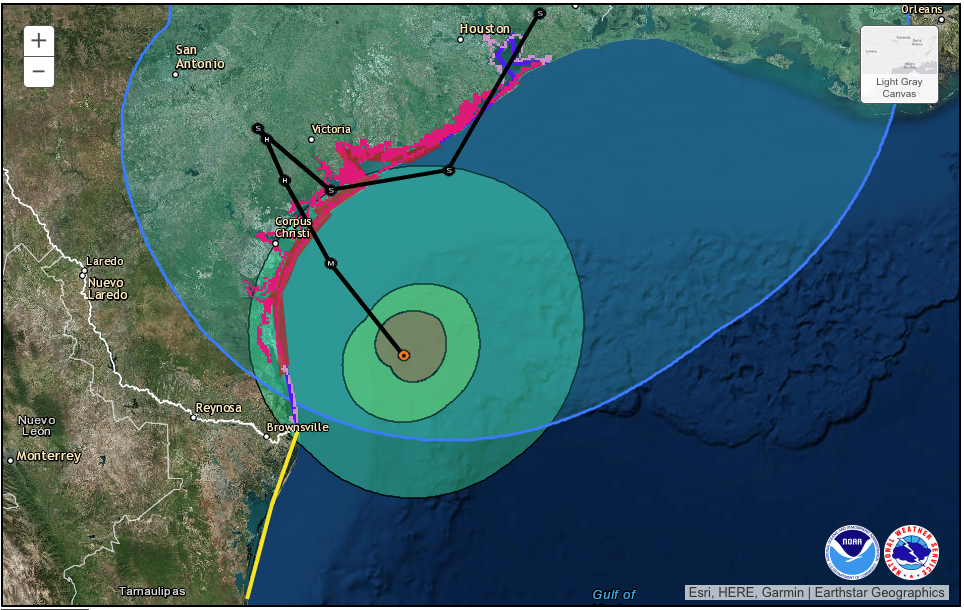
However, more ominous than the rapid intensification and potential devastating storm surge and winds at landfall, was the forecast track that the NHC issued as part of advisory #21 at 10AM CDT Friday 25th August, as shown in figure 4 below. The track showed Harvey making landfall and then meandering aimlessly over the same area for at least 48hrs. The Houston area had seen a similar scenario play out with Tropical Storm Allison not long before, back in 2001. Back then, parts of Houston were inundated by flood waters as Alison barely moved for almost 48-hrs and dumped up to 36” in places in the Houston Metro area.
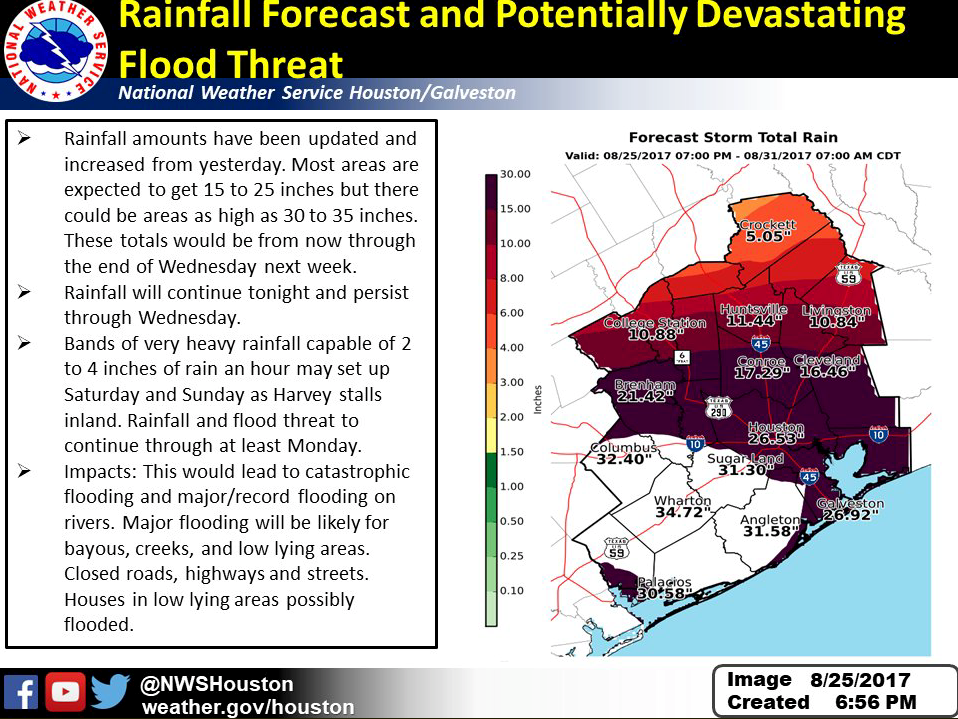
The National Weather Service issued a dire rainfall forecast for much of Southeastern Texas, including the nation’s fourth largest city, Houston. The potential for devastating flooding was a very real concern even as Harvey was making landfall around the time the warning was issued. Note, that at the time, very large rainfall totals were being forecast, with most areas affected by Harvey expected to receive between 15” and 25”, but that certain areas could receive upwards of 35” between Friday and Wednesday 30th. Very heavy rainfall of between 2” to 4” an hour was forecast in the rain bands associated with Harvey. The outcome was plainly obvious: record breaking catastrophic flooding of low lying areas, bayous, creeks and rivers, especially in the metro regions of Houston. FEMA (Federal Emergency Management Agency) director, Brock Long, was quoted as saying “Texas is about to have a very significant disaster”.
Actual landfall of Harvey was devastating. Harvey destroyed much in its path with winds gusting over 145mph at times accompanied with a 6-9” foot storm surge totally inundating low lying coastal areas. Rockport, Texas, bore the brunt of the land falling category 4 hurricane leaving the small community with widespread devastation. Harvey was downgraded to a tropical storm early on Saturday morning as sustained winds dropped below 74mph. By Saturday morning 338,000 people were without power along the Texas coast and in Houston, at least 21,000 were without power according to the Electric Reliability Council of Texas.
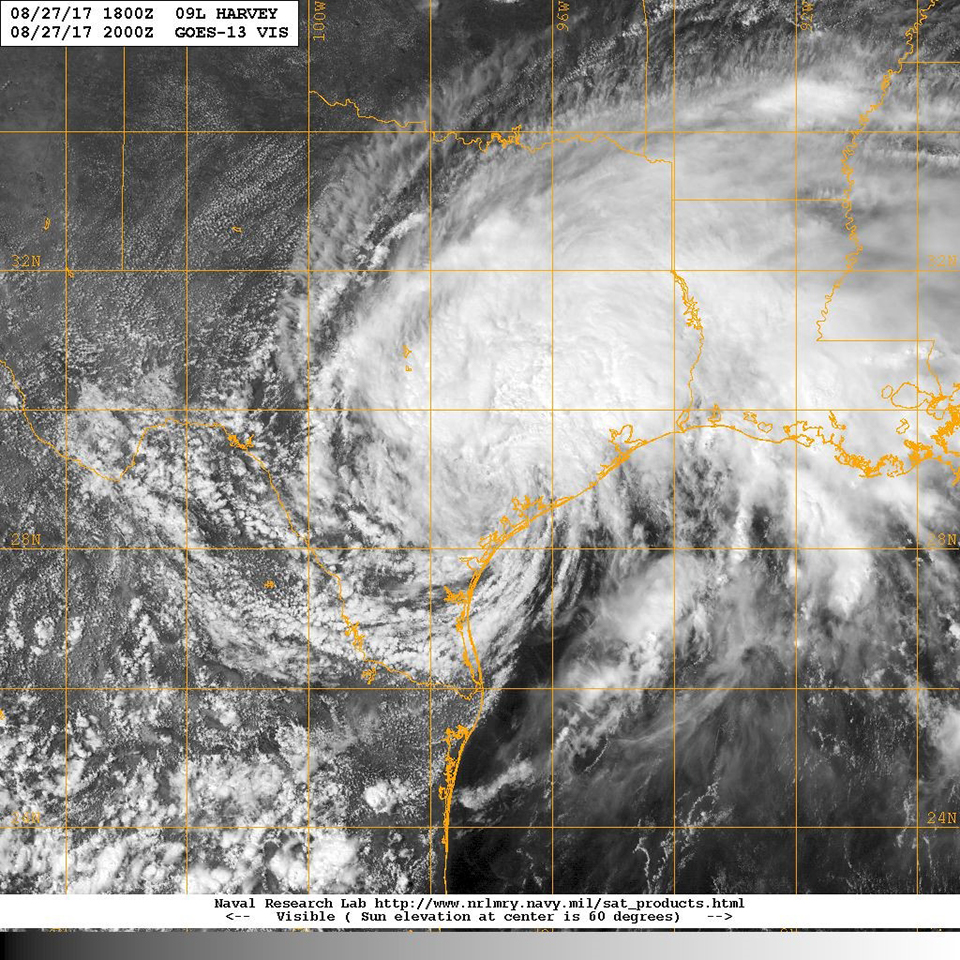
Typically, a land falling tropical system will weaken substantially and move out of the area, thanks to upper-level steering winds, however, the true disaster was only starting as Harvey become almost stationary on Saturday. Caught between two areas of high pressure and lacking any upper-level steering winds, Harvey simply meandered aimlessly over the same area for most of the weekend. Figure 6 below shows Tropical Storm Harvey west of Houston at 3PM on Sunday 27th August.
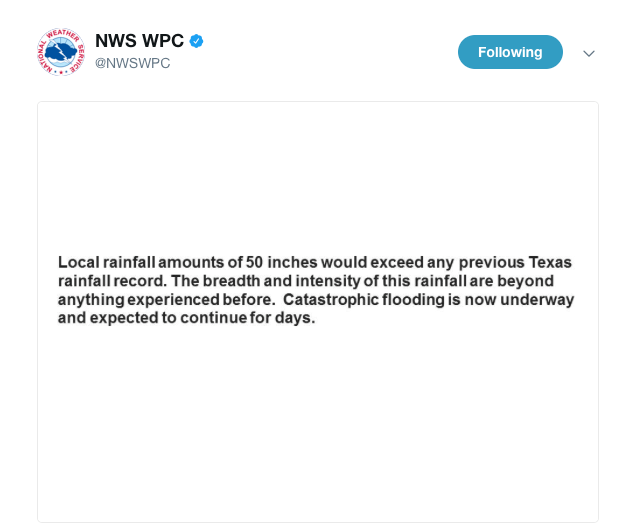
Torrential rains continued over the same areas for most of the weekend with some areas having already received up to a 2 FEET of rain late on Sunday. Widespread severe flooding was reported in the metro area of Houston. To make matters worse on Sunday, the European Forecast model (ECMWF) was still forecasting another 15” to 25” of rain on top of the rain that had already fallen, because Harvey was moving so slowly. This lead the Weather Prediction Center (WPC) to issue this extremely dire warning via twitter on Sunday evening. (Shown in Figure 7 below).
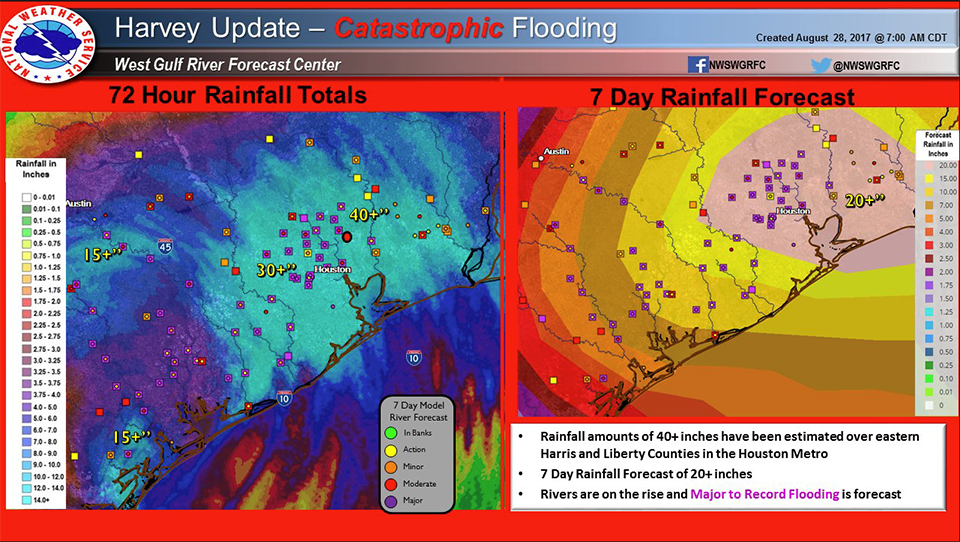
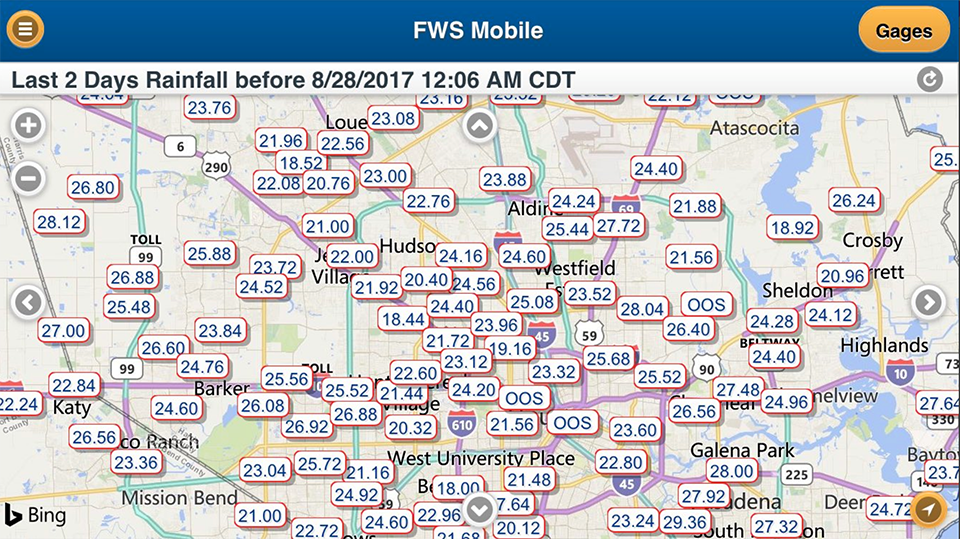
And the rains continued into Monday, 28th August. Figure 8 shows the 2-day rainfall ending 12:06AM CDT over much of the Houston Metro area. Generally, between 20” to 27” was observed over most of the area.
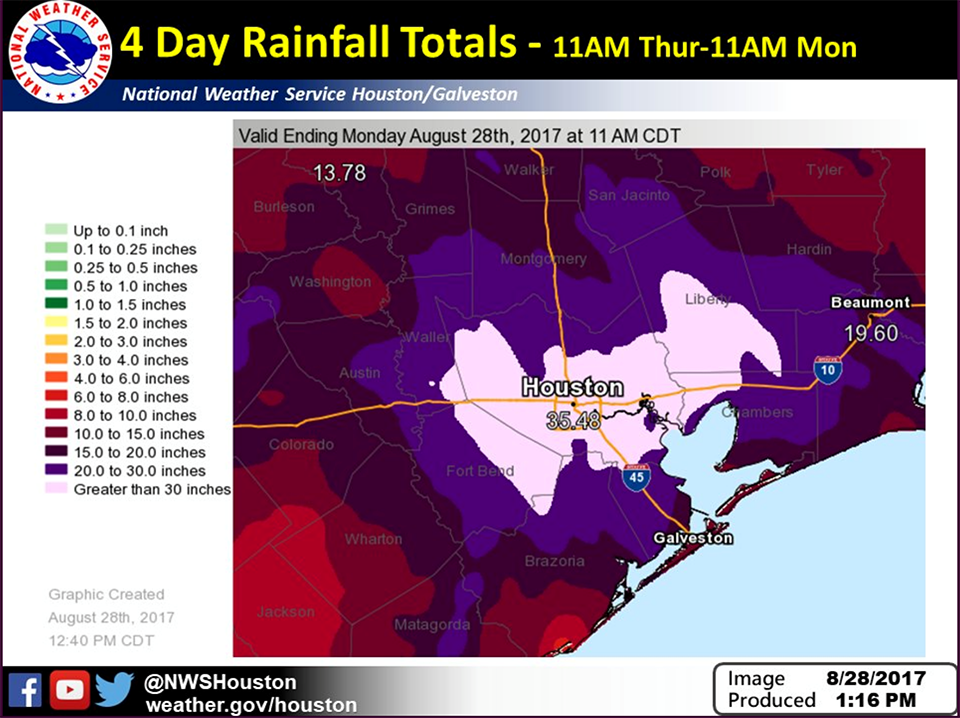
However, more impressive are the 4-day rainfall totals ending at 11AM CDT Monday, 28th August as seen in Figure 9 below. The National Weather Service had to actually update their color legend to accommodate the extremely high values of 35.48” measured in Houston during this 4-day period. Estimates of over 40” in places over the far eastern areas of the Houston Metro have been reported, but not confirmed as of today.
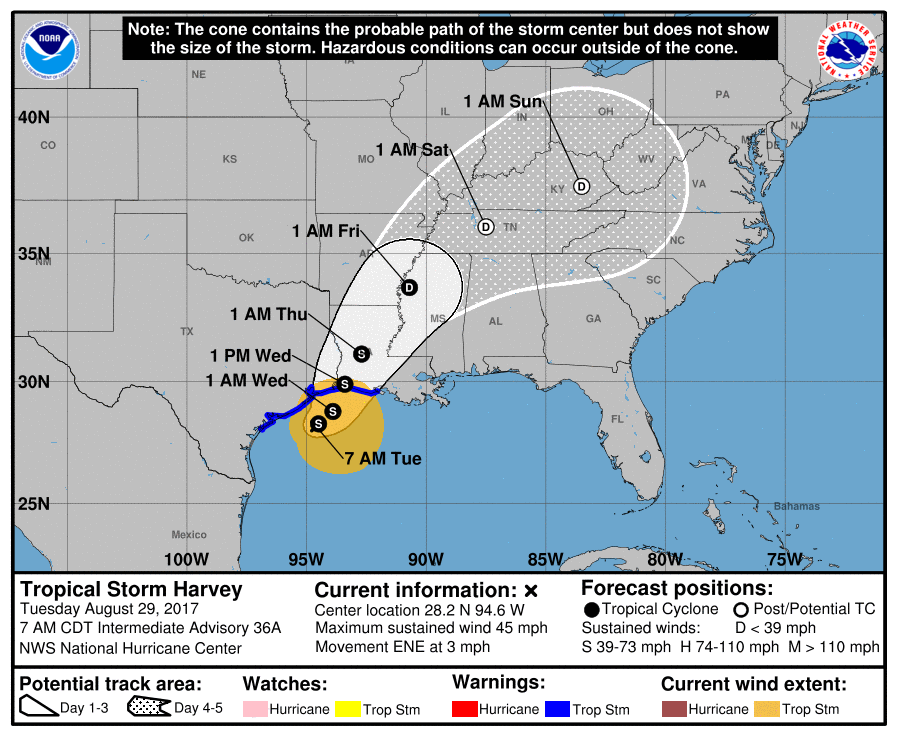
However, the disaster is not over. Fortunately, the latest NHC advisory as of 7 AM CDT, Tuesday 29th August shows Harvey finally moving back over water, making a second landfall well east of Houston early Wednesday morning, and then gradually moving out of the area by later Wednesday (see Figure 10 below).
However, Harvey has the potential to strengthen as it moves back over the warm waters of the Gulf of Mexico before it makes its second landfall. Figure 11 shows that a further 20” of rain is possible over the Houston area and hence the ongoing catastrophic and life-threatening flooding will continue across southeastern Texas with isolated storm totals as high as 50” possible before all is said and done.