Hurricane Irma – Post Event Analysis
ContactRelief Meteorologist Dr. Kevin Levey examines Hurricane Irma.
Tuesday, 12 September 2017 18:00:00 -05:00
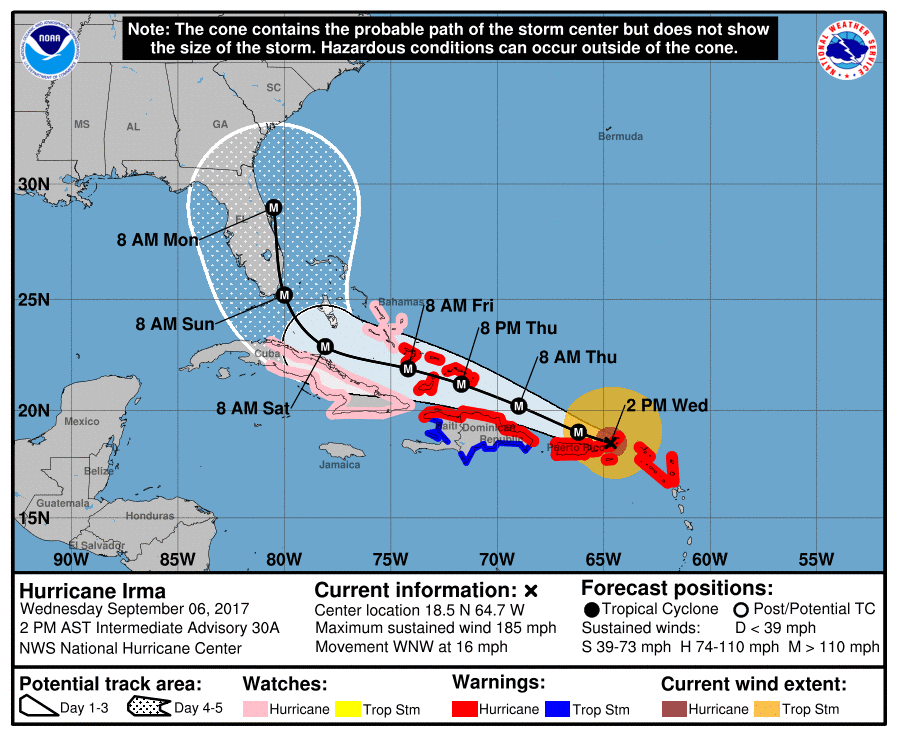
To say the last two weeks have been busy weather-wise, would be an understatement. With two category 4 hurricane landfalls in the United States in about 15 days, the Atlantic Ocean has suddenly become very busy indeed. Let’s go back to last week Wednesday, 6th September, when we were watching three active storms in the Atlantic and Gulf of Mexico as shown in Figure 1 below.
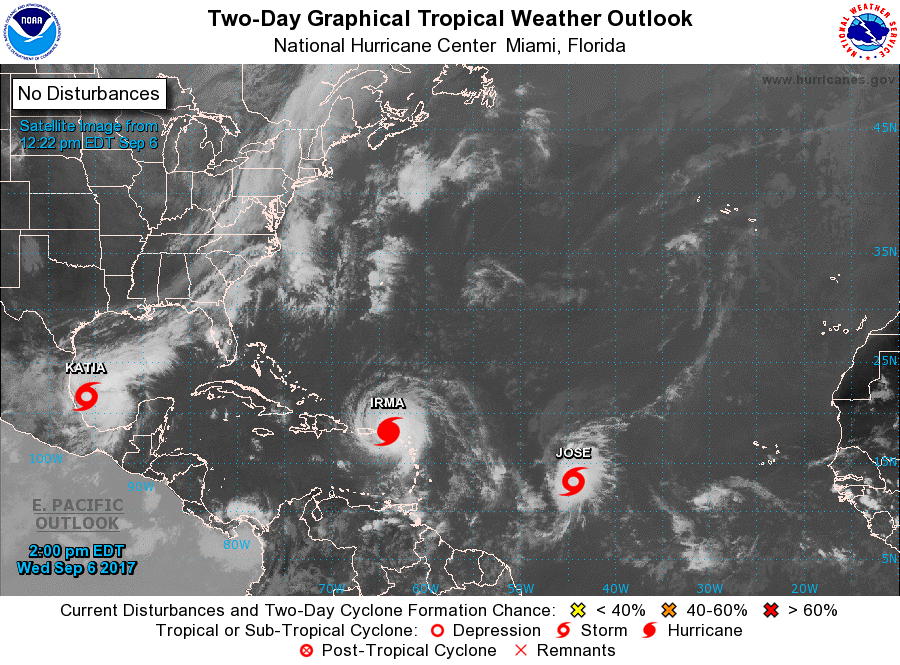
Tropical Storm Katia formed late on the 5th of September in the Gulf of Mexico in the Bay of Campeche, while Tropical Storm Jose was hot on the heels of the major story of the day: Hurricane Irma. With winds of 185 mph, Irma had at the time winds on the extreme outer limits of a category 5 hurricane which is defined as a storm with sustained winds of > 157 mph. Katia briefly became a category 2 Hurricane before making landfall over southeastern Mexico late on Friday, Sep 8th before rapidly weakening into a tropical depression.
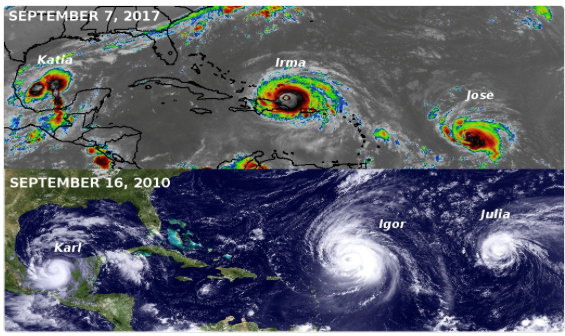
There was a very uncanny “deja-vu” on Thursday the 7th of September with an almost identical satellite image some 7 years before with the same lettered storms in almost the same place as shown in figure 2 below.
After forming in the well-known hurricane breeding ground in the Atlantic Ocean known as the “Azores” off the coast of Africa on Thursday, August 3l, all eyes were on Hurricane Irma which rapidly intensified and became the strongest ever recorded hurricane in the open Atlantic Ocean with sustained wind speeds of 185mph by Tuesday, September 5th, as shown in Figure 3 below.
It had been over 25 years since a category 5 hurricane had made landfall in the United States when Hurricane Andrew hit the US (Florida) in 1992. There have only been two other instances of a category 5 hurricane hitting the US, Hurricane Camille in 1969 (MS) and an unnamed storm on Labor Day in 1935 in the Florida Keys. Category 5 hurricanes cause catastrophic damage, destroying a very high percentage of homes, often causing total roof failure and walls to collapse. Power outages can last from weeks to months and in many instances, can cause areas to be uninhabitable for weeks to months.
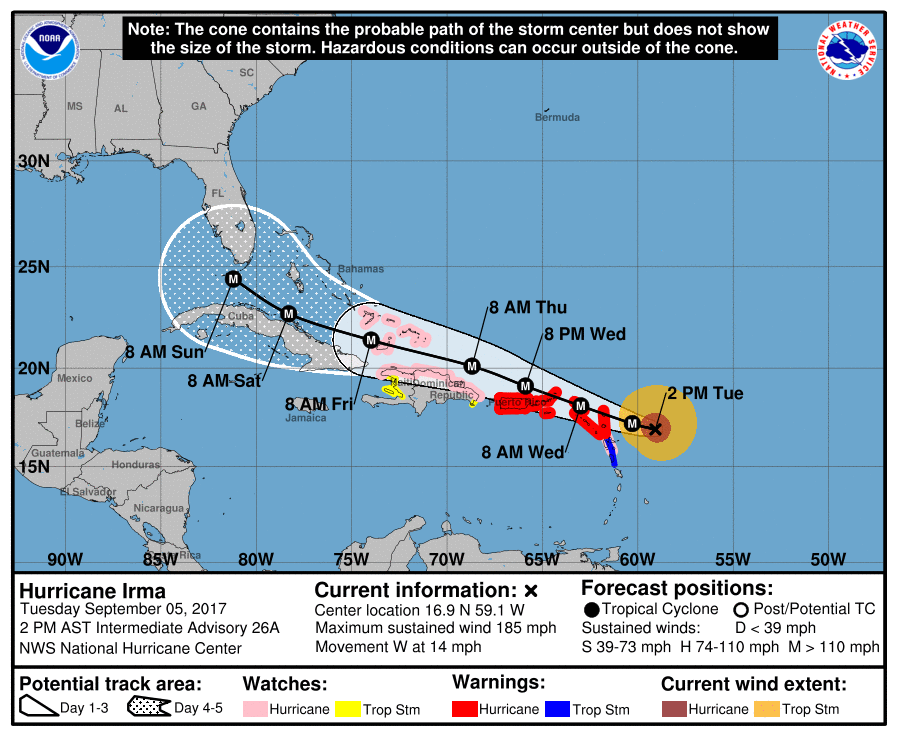
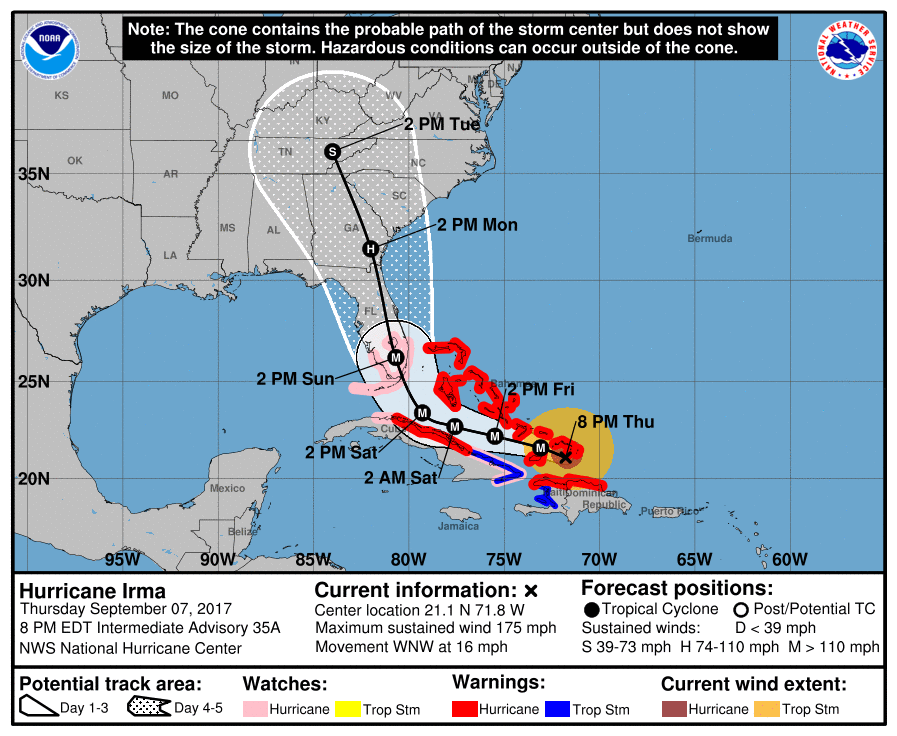
Twenty-four hours later Hurricane Irma was still a major category 5 hurricane with sustained winds of 185mph and the National Hurricane Center had updated the track which then had Irma moving over the east coast of Florida. Figure 4 below shows the forecast track for Hurricane Irma on Wednesday 6th September at 2 PM AST.
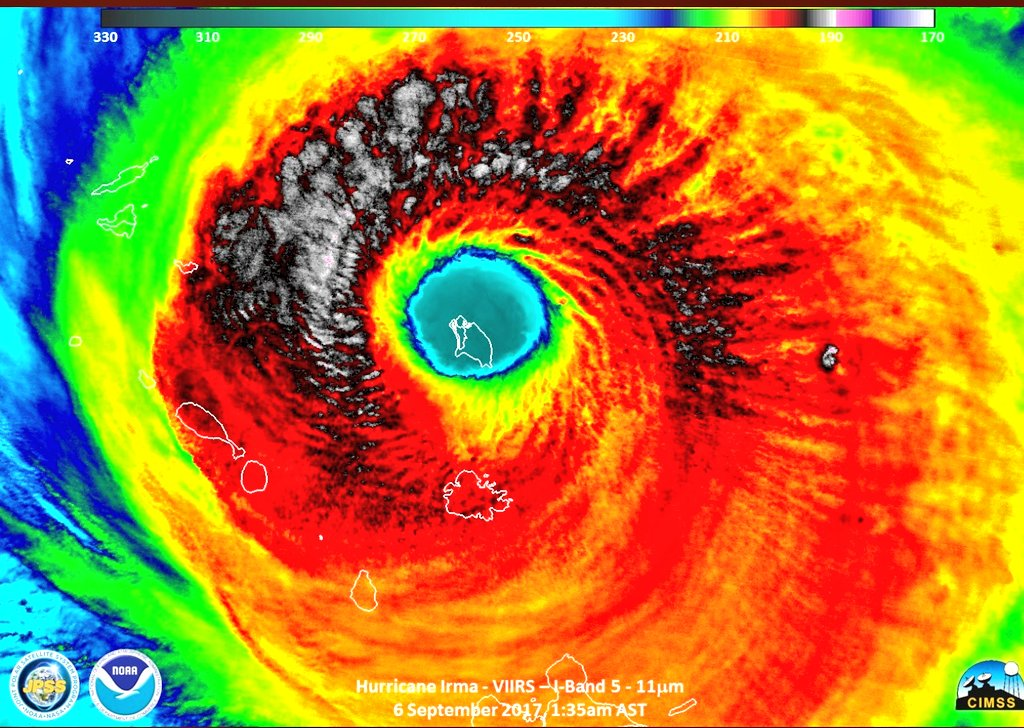
Within that 24-hour period many of the leeward Islands bore the brunt of Category 5 Hurricane Irma, with Barbuda taking a direct hit, literally obliterating the island from the face of the earth. The infrared satellite image below in Figure 5 shows Barbuda clearly in the eye of Hurricane Irma on the 6th of September at 1:35 AM AST.
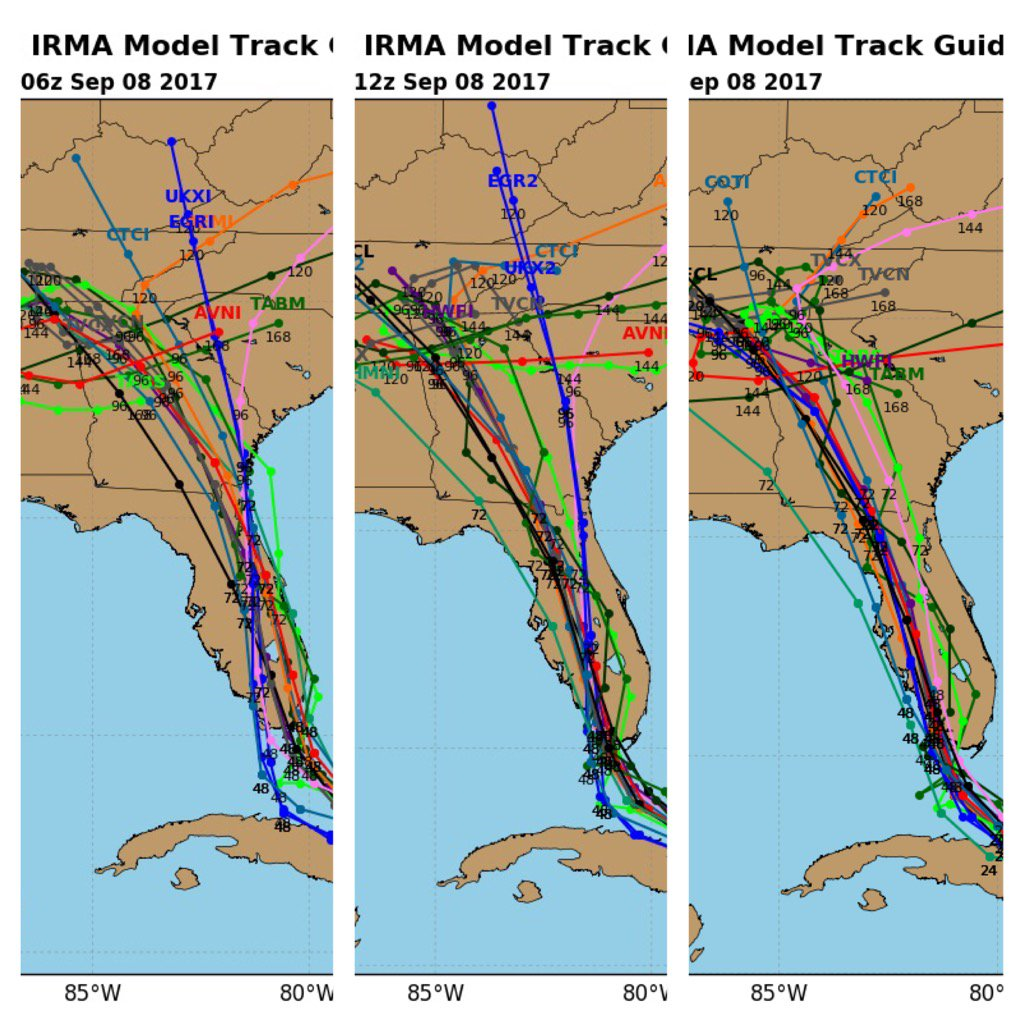
By this stage the NHC was confident in the 3-day forecast track, at least until 8 AM AST on Saturday morning. After that, the NHC was less sure as there was still a fair amount of uncertainty regarding the exact timing and location of the recurvature towards the north. The reason for this was whether the upper-level steering currents of the Jetstream would pick up Hurricane Irma and move it northwards. The NHC reminds users that the average NHC track errors at days 4 and 5 are about 175 and 225 statute miles, respectively. This meant that a more reliable forecast would only emerge near the Bahamas and Florida by late Thursday the 7th of September. Anticipation for a direct category 5 hurricane landfall over Florida had become a very distinct possibility by Thursday evening when the NHC released their latest forecast track as shown in Figure 5 below. Hurricane watches had been posted for much of southern Florida and evacuation orders had been issued. The NHC was expecting a category 4 landfall over the Florida Keys, then tracking northwards over the State of Florida.
This track was slightly better than a direct hit on Miami, but as mentioned before and as seen in Figure 6 below, Hurricane Irma could have ended up anywhere in the cone of uncertainty. The solid black line in the middle, was the most likely track based on the forecast at the time from a variety of weather models.
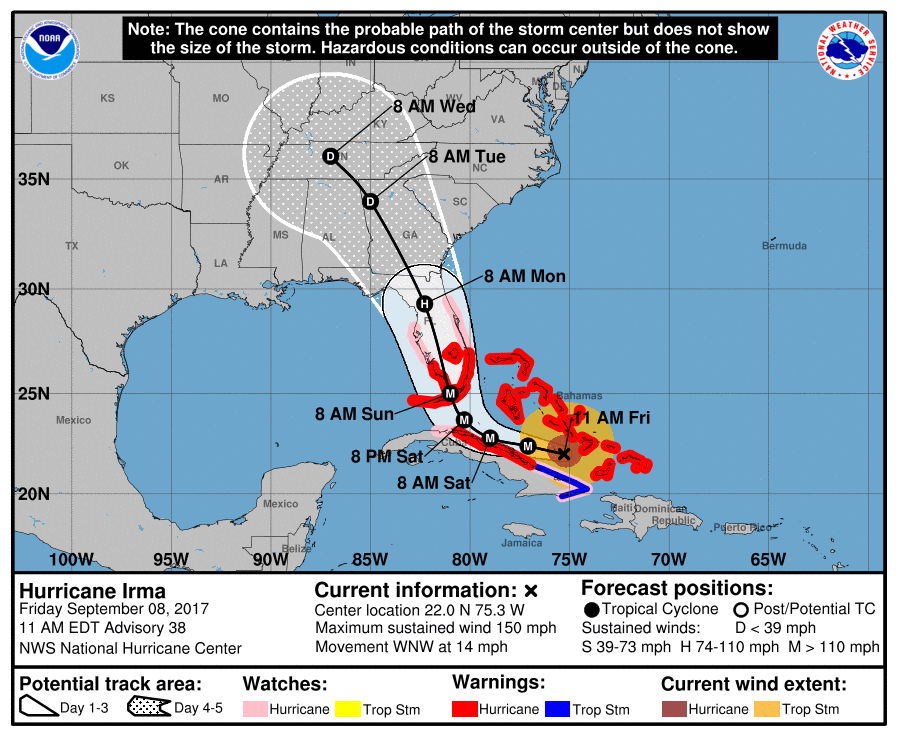
The fear was that as Irma moved north of Cuba that any weakening from its interaction with Cuba would be offset by the very warm waters in that region. By Friday morning, September 8th, at 11 AM EDT Hurricane warnings had been issued for all of southern Florida with a subtle westward shift of the track over the center of Florida as seen in Figure 7 below.
This was good news for the east coast of Florida, sparing a direct hit on Miami, but concern then grew for the west coast of Florida as models gradually kept moving the track of Hurricane Irma further and further westwards as seen in Figure 8 below.
Had the track continued to be shifted over open water along the west coast of Florida, it would have meant a tremendous possibility of major flooding of Tampa Bay and Naples.
Hurricane Irma final made landfall between Key West and Marathon as a major category 4 hurricane with sustained winds of 130 mph and a central pressure of 929 mb. Irma battered the entire state of Florida for much of Sunday, September 10th, as it moved north just to the east of Tampa. Thankfully, it weakened rapidly owing to its trajectory over land and major cities like Tampa dodged the bullet. 50 miles to the west would have been catastrophic for Tampa Bay. Figure 9 below shows the final track of Irma over Florida. The track was pretty consistent with the 18Z ensemble model runs shown in Figure 8 above.
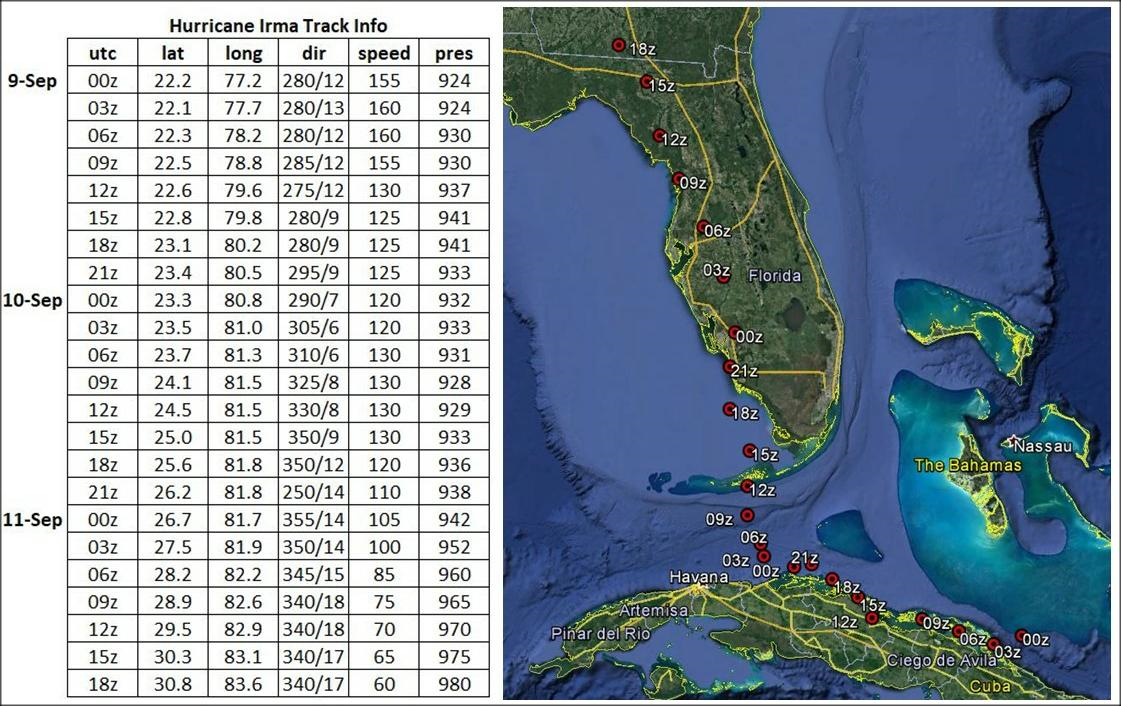
As of Monday, September 11th, there were over 10 million are without power in the state of Florida according to Florida Power and Light.
The National Hurricane Center did an outstanding job predicting the track of Hurricane Irma.
Finally, here are some astounding facts about Irma (whose name will be retired from the list of hurricane names) (thanks to Philip Klotzbach, CSU)
Intensity Measures
- 185 mph lifetime max winds – tied with Florida Keys (1935), Gilbert (1988) and Wilma (2005) for second strongest max winds of all time in Atlantic hurricane. Allen had max winds of 190 mph in 1980;
- 185 mph lifetime max winds – the strongest storm to exist in the Atlantic Ocean outside of the Caribbean and Gulf of Mexico on record;
- 185 mph max winds for 37 hours – the longest any cyclone around the globe has maintained that intensity on record. The previous record was Haiyan in the NW Pacific at 24 hours;
- 914 mb lifetime minimum central pressure – lowest since Dean (2007) and 10th lowest in satellite era (since 1966);
- First Category 5 hurricane in the Atlantic since Matthew (2016) and first Category 5 hurricane in the tropical Atlantic (7.5-20°N, 60-20°W) since Hugo (1989);
- 3.25-day lifetime as a Category 5 hurricane – tied with Cuba (1932) for longest lifetime as Category 5;
- Three consecutive days as a Category 5 hurricane – the longest in the satellite era (since 1966).
Landfall Records
- Leeward Islands: Strongest storm on record to impact the Leeward Islands defined as 15-19°N, 65-60°W for this calculation, with max winds of 185 mph. Okeechobee Hurricane (1928) and David (1979) were previous strongest at 160 mph;
- Turks and Caicos: Closest approach of a Category 5 hurricane on record;
- The Bahamas: First Category 5 hurricane to make landfall since Andrew (1992)
- Cuba: 160 mph, 924 mb – Category 5
- First Category 5 hurricane to make landfall since the Cuba Hurricane of 1924;
-
Continental United States:
- 1st Landfall: (Cudjoe Key, FL): 130 mph, 929 mb – Category 4
- First Category 4 hurricane to make landfall in Florida since Charley (2004) and major hurricane to make landfall in Florida since Wilma (2005);
- 929 mb pressure at first landfall is tied for 7th lowest on record with Lake Okeechobee Hurricane of 1928;
- 2nd Landfall ((Marco Island, FL): 115 mph, 940 mb – Category 3
- Exact same latitude/longitude as well as same Saffir/Simpson Category at landfall as Wilma (2005): 25.9°N, 81.7°W.
Get in touch
Shaping your outbound contact away from disaster stricken areas isn't just the right thing to do, it's smart business. To learn more about how ContactRelief can help you protect your brand, reduce your risk of adverse actions, and improve your contact center efficiency, click below to contact us.
Contact us