Looking ahead to this winter!
ContactRelief Consulting Meteorologist Dr. Kevin Levey looks at the long-range precipitation forecast for the upcoming winter season.
Wednesday, 04 October 2017 09:00:00 -05:00
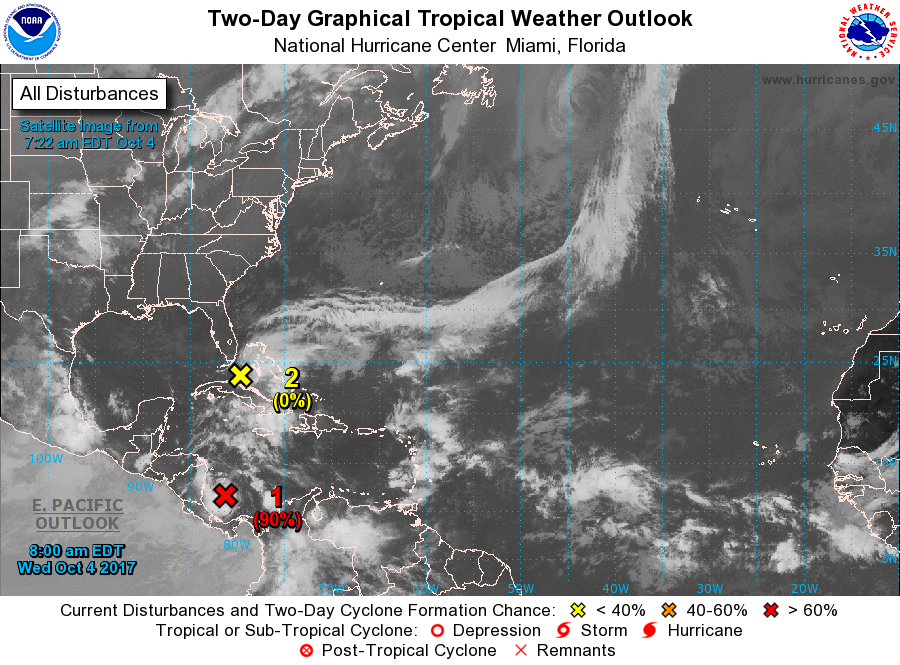
As we enter the first week of October, the Atlantic Ocean has most definitely quietened down after an incredibly busy late August and a most memorable September. Figure 1 below shows only one tropical disturbance with a high degree of formation potential in the southwest Carribean Sea. This storm is expected to be declared a tropical depression later today with the potential of moving into the Gulf of Mexico by the weekend. To the east, the broad area of the North Atlantic Ocean is devoid of any tropical activity for the first time since early August. With Puerto Rico still reeling after Hurricane Maria, this is great news for everyone there.
I typically get asked around this time of the year by various groups and organizations about what we can expect this upcoming winter regarding precipitation and temperature. This is especially true for the winter rainfall regions of the West Coast and the interior of the country: “Are we in for a wet winter? Are we in for a cold winter?” are typical questions you may be asking.
There are a number of climate models that try and predict the temperature and precipitation on a monthly basis for at least six months into the future. The North American Multi-Model Ensemble (NMME) is an experimental multi-model seasonal forecasting system consisting of coupled models from US modeling centers including NOAA/NCEP, NOAA/GFDL, IRI, NCAR, NASA, and Canada's CMC. Instead of just using one single model, the NMME is preferred since it is a combination of many climate models and yields better forecasts than any one single individual model. In today’s posting, I will only discuss the monthly precipitation outlooks and next week, we will look at the monthly temperature outlooks for the USA. The following maps show the expected monthly rainfall departures (in millimeters per day – 25.4mm = 1 inch).
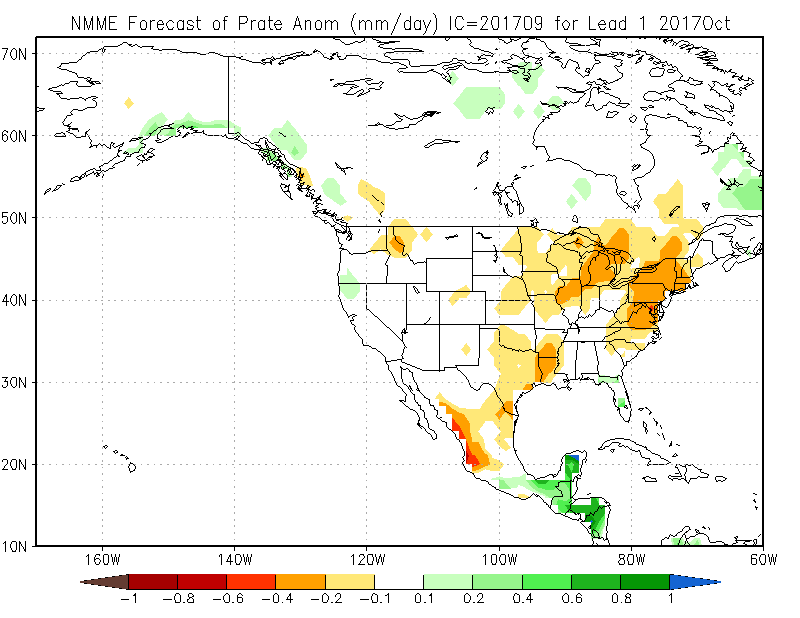
Figure 2 above shows that for October 2017, the eastern part of the USA, especially the Northeast, should expect below average rainfall. Most of the Midwest, Texas, Louisiana and northern Idaho and far western Montana should also expect below average rainfall. Only far northern California, southern Oregon and parts of Florida should expect slightly above average rainfall. The remainder of the country should expect mostly average rainfall.
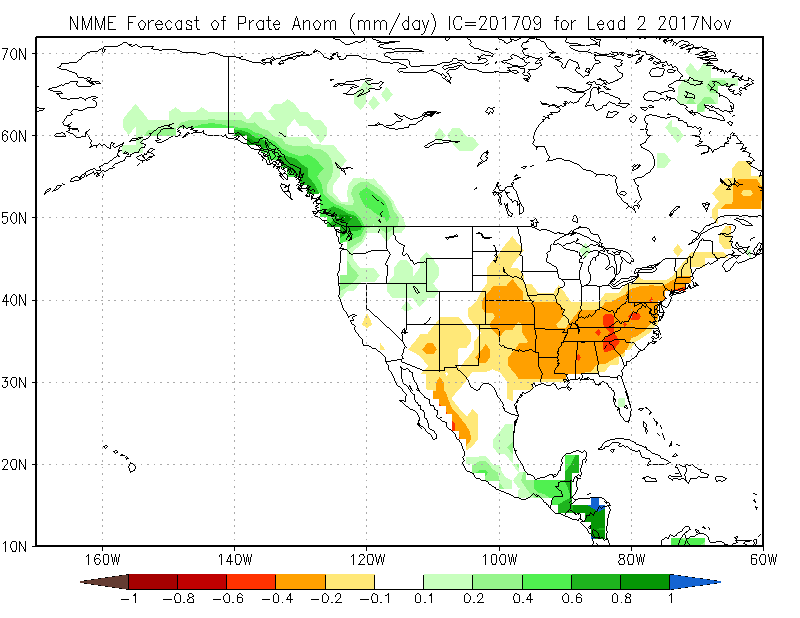
Figure 3 above, shows almost the entire Central and Southern Plains and most of the eastern half of the USA should expect below average rainfall, with parts of eastern Kentucky and Tennessee, northern Georgia and western Virginia showing expected medium to severe rainfall deficits. It is also expected to be drier than normal over the four corners. The Pacific Northwest should expect above average rainfall, including parts of southern Oregon and far northern California. The remainder of the country should expect mostly average rainfall during November 2017.
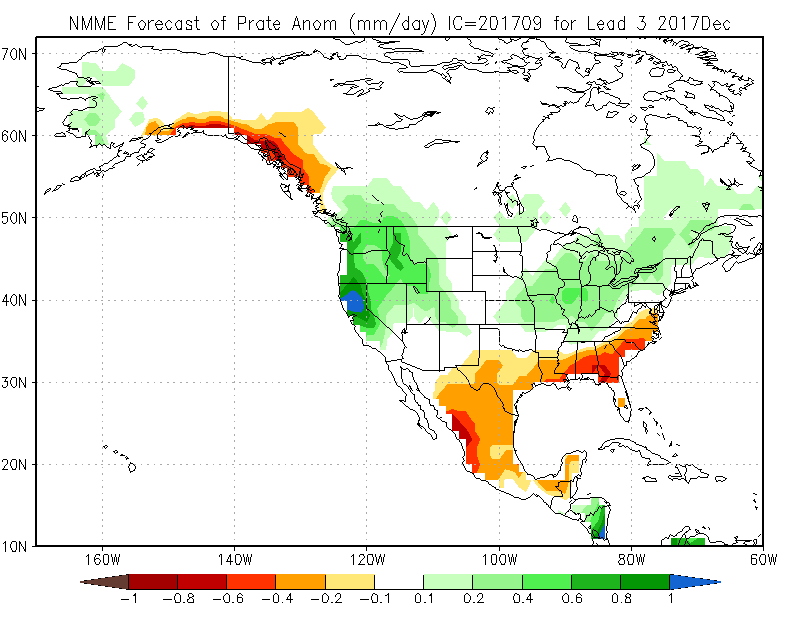
Figure 4 above, shows that December 2017 will be dry over the southern parts of the Gulf coastal states, stretching from Texas in the west to southern Alabama and Georgia and then up the east coast into the mid-Atlantic states like Virginia. Much of the Pacific Northwest, Central and Northern California will be very wet, while much of the Ohio Valley and Midwest shows a recovery in expected rainfall, with somewhat above average rainfall. Central California looks to expect a lot above average rainfall. The remainder of the country should expect mostly average rainfall conditions.
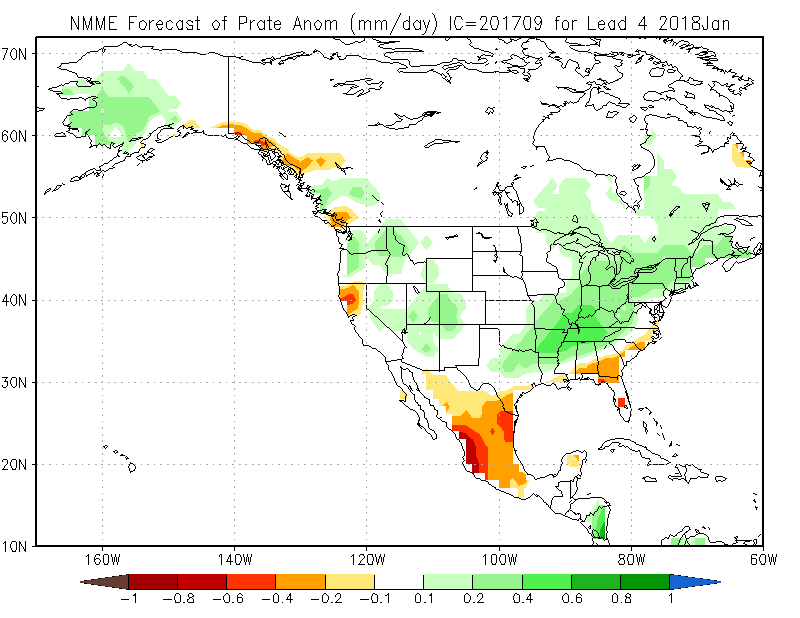
Figure 5 above, shows continued below average rainfall in January 2018 over the coastal areas of the Gulf states, including Florida. Below average rainfall should also be expected over the Central and Northern California. Continued above average rainfall should be expected over the Ohio Valley, Kentucky, Tennessee and the Midwest. The remainder of the country should experience mostly average rainfall during January 2018.
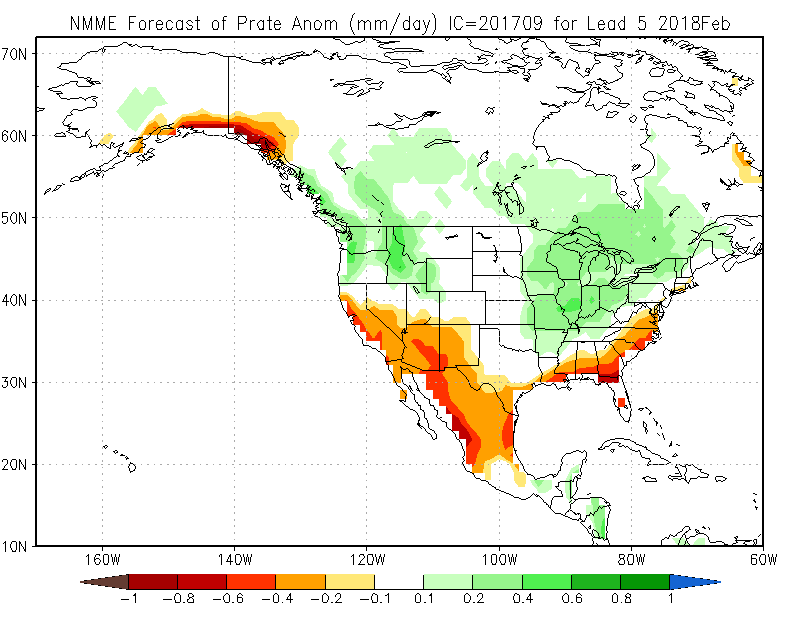
Figure 6 above, shows that during February 2018, Central and Southern California and all the coastal areas of the Gulf states, the southeast and mid-Atlantic states will experience much below average rainfall. This pattern is typical of La Nina conditions. The Pacific Northwest, most of the Ohio Valley, Midwest and New England should experience above average rainfall. The remainder of the country should expect mostly average rainfall.
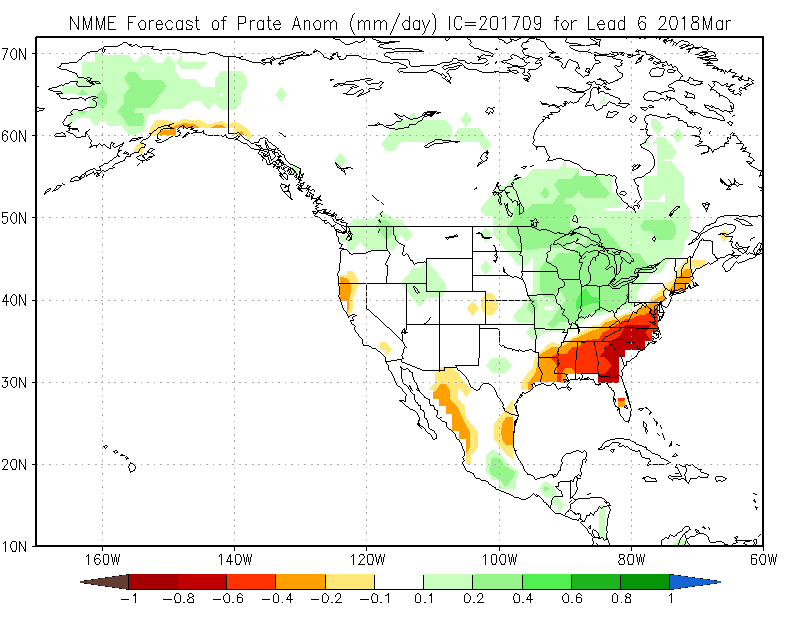
Finally, Figure 7 above, shows that March 2018 will be extremely dry in the coastal areas of Alabama and Georgia, the southeastern and Mid-Atlantic states. Lingering below average rainfall over far northern California and parts of New England centered over Massachusetts should also be expected. The Ohio Valley and Midwest should see continuing above average rainfall conditions.
Want to know precisely who NOT to contact during a disaster?
Find out with a free trial