Wild Wild WildFire Weather
ContactRelief Consulting Meteorologist Dr. Kevin Levey looks at the wild wildfire weather affected Northern California.
Tuesday, 17 October 2017 08:00:00 -05:00
Understanding Wildfire Weather
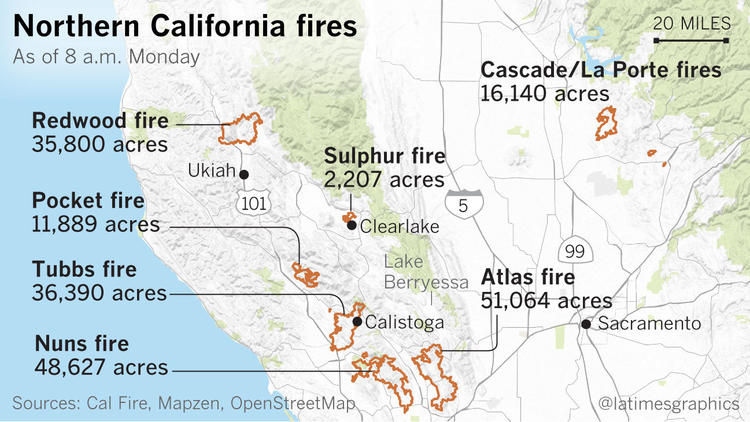
The big news of the past week has been the catastrophic rural and urban wildfires that have affected the Wine Country of Northern California and more specifically, counties just north of San Francisco, including Napa, Sonoma, Solano, Lake, and Mendocino counties. Over 25 fires began overnight a week ago, in the early hours of Monday morning, 9th October (most probably by downed power lines, although the cause of the fires has yet to be determined). As of Monday 16th October, 40 people have lost their lives, 220,000 acres have burned and an estimated 5700 structures have burned to the ground. Figure 1 below shows the current state of the fires in Northern California as of Monday at 8 AM PDT.
Let’s look at the very rare weather conditions, described as an 11 on a scale of 1 to 10 that took place to create these nightmarish fires that destroyed entire neighborhoods of Santa Rosa, some 65 miles north of San Francisco.
The National Weather Service (NWS) issued a red flag warning well in advance of this devastating event. What is a red flag warning? The NWS defines a red flag warning as follows:
A term used by fire-weather forecasters to call attention to limited weather conditions of particular importance that may result in extreme burning conditions. It is issued when it is an on-going event or the fire weather forecaster has a high degree of confidence that Red Flag criteria will occur within 24 hours of issuance. Red Flag criteria occurs whenever a geographical area has been in a dry spell for a week or two or for a shorter period if before spring green-up or after fall color, and the National Fire Danger Rating System (NFDRS) is high to extreme and the following forecast weather parameters are forecasted to be met:
- A sustained wind average 15 mph or greater
- Relative humidity less than or equal to 25 percent and
- A temperature of greater than 75 degrees F.
In some states, dry lightning and unstable air are criteria and a Fire Weather Watch may be issued before the Red Flag Warning.
October is a critical month for wildfires in California since it is at the end of the dry season with a lot of tinder dry vegetation and is also a very warm month with temperatures above 80°F, low humidity and frequent off-shore wind events, which are typically very hazardous for fire conditions. One only needs to remember the previous devastating firestorm that ravaged the Oakland Hills in October of 1991 during an unusual off-shore or “Diablo Wind” event. Most people are more familiar with the cousin of the Diablo Winds in Southern California, where they are known as the Santa Anna winds. However, very similar weather conditions produce these offshore wind events, but the Diablo Winds are much less commonplace in Northern California. Unfortunately, a complex mix of meteorology, physics, geography, and topography all worked together in a highly unusual Diablo Wind event.
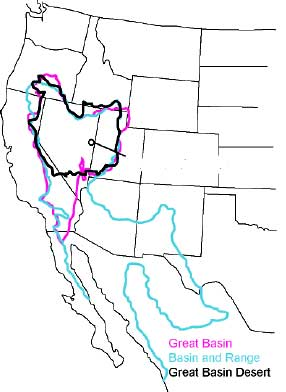
The weather setup that causes strong offshore winds results from a strong high-pressure system (where air is descending and warming and diverging far from its center) that is located over the Great Basin of the United States as shown in Figure 2 below:
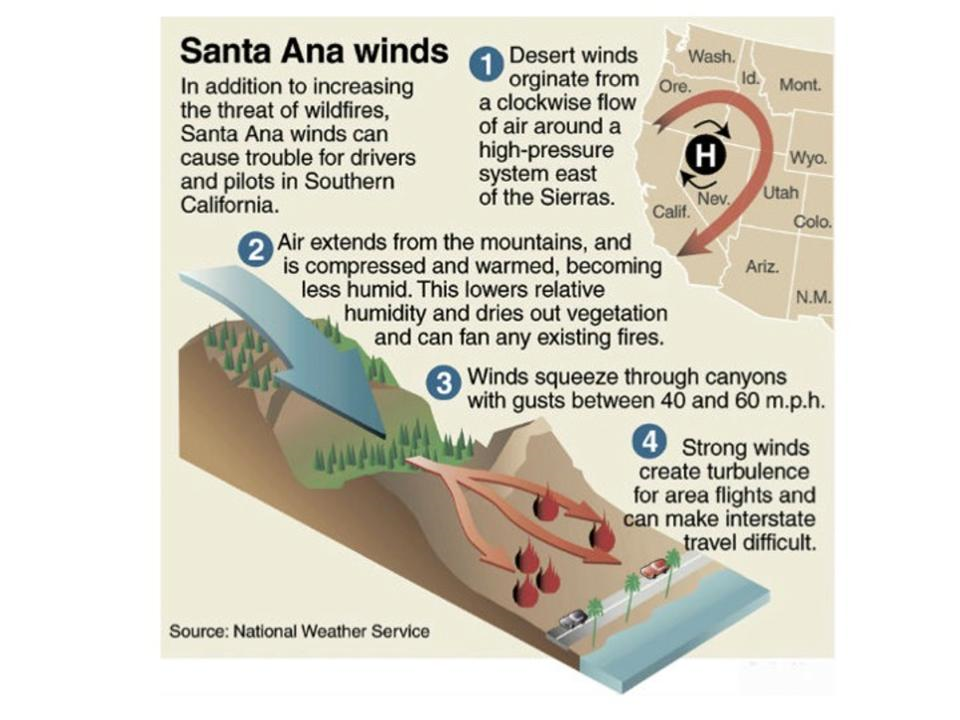
Winds blow towards the coast of California from the North East, and as they descend they warm up owing to compression and dry out as a result of evaporation of any clouds in the sky. The strength of the winds is dependent on the pressure gradient (or how much the pressure changes) between the high-pressure system and a low-pressure system off the coast of California. The strongest winds are usually found at higher elevations, especially near the summits of the higher coastal hills and mountains, but topography further enhances wind speeds by being squeezed through canyons of the coastal hills and mountains that abound in Northern and Southern California near the coast. Figure 3 below shows this schematically for the Santa Anna winds, but the theory applies equally for the Diablo winds.
Offshore wind events like these are not very common over the San Francisco Bay Area and areas northwards and rarely warrant a red flag warning. What was unusual about this event, was that the high-pressure system was unusually strong for this time of year and there was a deep low pressure off the coast. Therefore, the NWS forecast winds gusting in excess of 55 mph late Sunday night into Monday morning for the higher elevations of the coastal hills in the San Francisco Bay area, including the counties of Sonoma and Napa, Marin and Santa Cruz. What lead to this event becoming quite rare was the unusual strength of the high pressure creating an inversion or “cap/ceiling” at levels below the summits of the coastal hills and mountains further strengthening the winds blowing down the valleys and canyons (the analogy here is to think of water being squeezed through a narrow ravine – it immediately speeds up). So, unfortunately, for the residents of certain neighborhoods, fires that were started some 16 miles away were enhanced through the hills and mountains just east of Santa Rosa and reached speeds of 70 mph in the canyons and valleys right near the surface for hours on end in the early hours spreading the fires at phenomenal speeds. With winds reaching those speeds, it was essentially like having a blow torch on any embers and existing fires. The result was a conflagration never seen before California. People literally had minutes, if not seconds to evacuate with only the clothes on their backs.
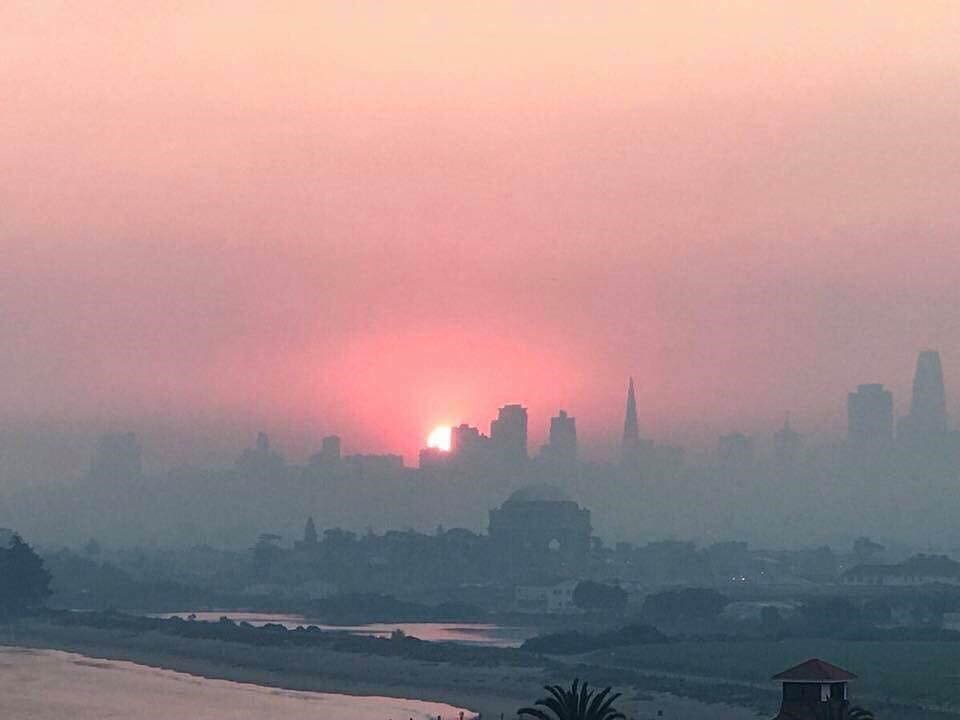
The fires also had another major effect on the region – the worst air quality ever recorded in the region, including San Francisco, with particulate matter from the fires at record, never seen before, highs. Figure 4 below shows the air quality at sunrise on Thursday, 12th October.