The Arctic Oscillation and Pacific Decadal Oscillation
ContactRelief Consulting Meteorologist Dr. Kevin Levey explains the Arctic and Pacific Oscillation's effect on climate.
Tuesday, 19 December 2017 08:00:00 -06:00
Climate Phenomena Affecting North America
Last time I started covering a few of the main climate variability phenomena that affect the weather over North America and the North Atlantic Oscillation was discussed. Today I will discuss the Arctic Oscillation (AO) and the Pacific Decadal Oscillation (PDO) and how and when they affect the weather over the United States.
The Arctic Oscillation.
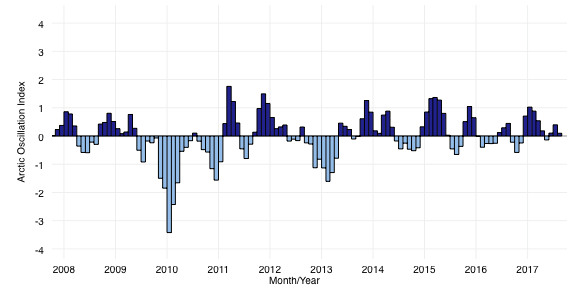
The AO essentially refers to the atmospheric circulation pattern over the mid-to-high latitudes of the Northern Hemisphere and directly affects the location of the Jetstream and therefore, the storms that the Jetstream steers from west to east. The phase of the oscillation is characterized by either higher or lower pressure over the arctic vs pressure over the northern Pacific and Atlantic Oceans. Figure 2 below, shows the monthly AO index since 2008.
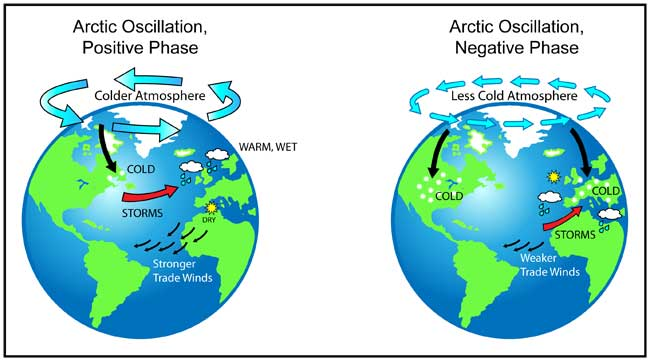
AO positive phase: The AO is said to be in a positive phase when lower-than-average atmospheric pressure occurs over the Arctic in conjunction with higher-than-average atmospheric pressure over the northern Pacific and Atlantic Oceans. As shown in Figure 3 below, this results in a stronger-than-average Jetstream and a northward shift of the storm track. The Jetstream is usually more zonal in nature meaning that the flow is generally more strongly west-to-east. The result is for the mid-latitudes of the United States to experience fewer cold air outbreaks than usual and general above average temperatures.
AO negative phase: The AO is said to be in a negative phase when higher-than-average atmospheric pressure occurs over the Arctic in conjunction with lower-than-average atmospheric pressure over the northern Pacific and Atlantic Oceans. As shown in Figure 3 below, this results in a stronger-than-average Jetstream and a northward shift of the storm track. The Jetstream is usually more meridional in nature meaning that the flow is generally less west-to-east, but more north-to-south and south-to north in a much wavier pattern. The result is for the mid-latitudes of the United States to experience a number of cold air outbreaks than usual and general above average temperatures. New England frequently observers a higher number of coastal storms known as “Nor’easters”.
As of October 2017, the current NAO index is +0.69. Current forecasts show it to change into negative territory for the remainder of November, therefore implying increased chances of cooler weather over much of the northern and eastern United States. The CAVEAT here is that there are many different climate variability phenomena that interact with each other, which can either enhance or dampen expected weather outcomes as mentioned above.
The Pacific Decadal Oscillation
Fisheries scientist Steven Hare coined the term "Pacific Decadal Oscillation" (PDO) in 1996 while researching connections between Alaska salmon production cycles and Pacific climate. Similar to the El Niño-Southern Oscillation (ENSO) phenomenon, the PDO goes through cycles of warm and cool phases which last on average 20-30 years, as opposed to ENSO events which persist for 6 to 18 months. Essentially the PDO, like ENSO, refers to above or below average temperatures over the central North Pacific Ocean and the west coast of North America. When temperatures are above average along the west coast of North America in a roughly horse-shoe shape and below average over the Central North Pacific, the PDO is in a condition called “warm or positive” phase and when the temperatures are below average over the west coast of North America and above average over the central North Pacific, the PDO is in a condition called “cool or negative” phase (much like EL Nino which is a “warm phase” phenomenon and La Nina is a “cold phase” phenomenon). Figure 3 below shows the PDO in a typical warm and cool phase condition.
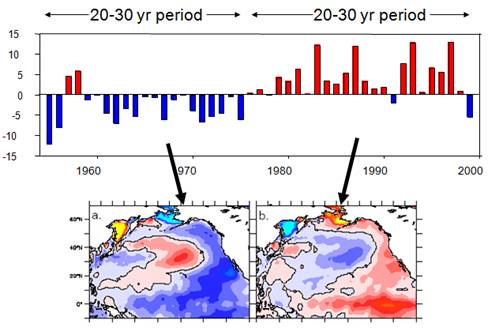
Figure 4 below shows the PDO index from 1980 to present. As of October 2017, the PDO was weakly negative, and a three-month running mean essentially has it as neutral – neither warm or cold.
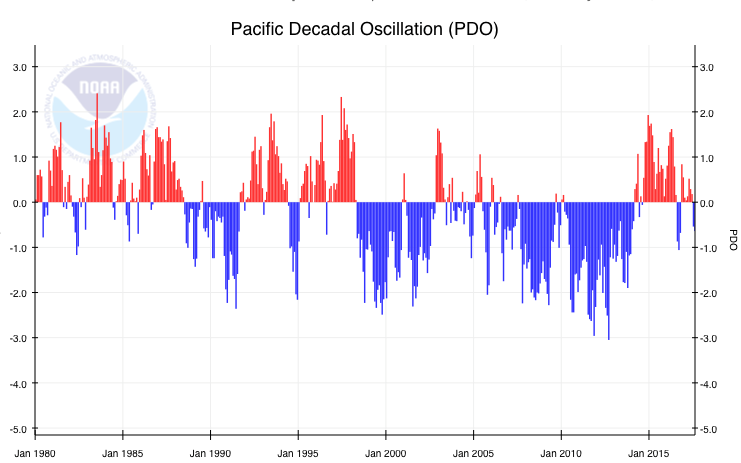
Table 1 below essentially summarizes the effects of the PDO on the climate of the United States.
Pacific and North American climate anomalies associated with extreme phases of the PDO
Climate Anomalies
Warm Phase PDO
Cool Phase PDO
Ocean surface temperatures in the northeastern and tropical Pacific
Above average
Below average
October-March northwestern North American air temperatures
Above average
Below average
October-March Southeastern US air temperatures
Below average
Above average
October-March southern US/Northern Mexico precipitation
Above average
Below average
October-March Northwestern North America and Great Lakes precipitation
Below average
Above average
Northwestern North American spring time snow pack and water year (October-September) stream flow
Below average
Above average
Winter and spring time flood risk in the Pacific Northwest
Below average
Above average
The interesting fact about the PDO is that it can either enhance or diminish the effects of El Niño and La Niña. Figure 5 below shows the distinct sea-surface temperature patterns associated with the PDO and ENSO.
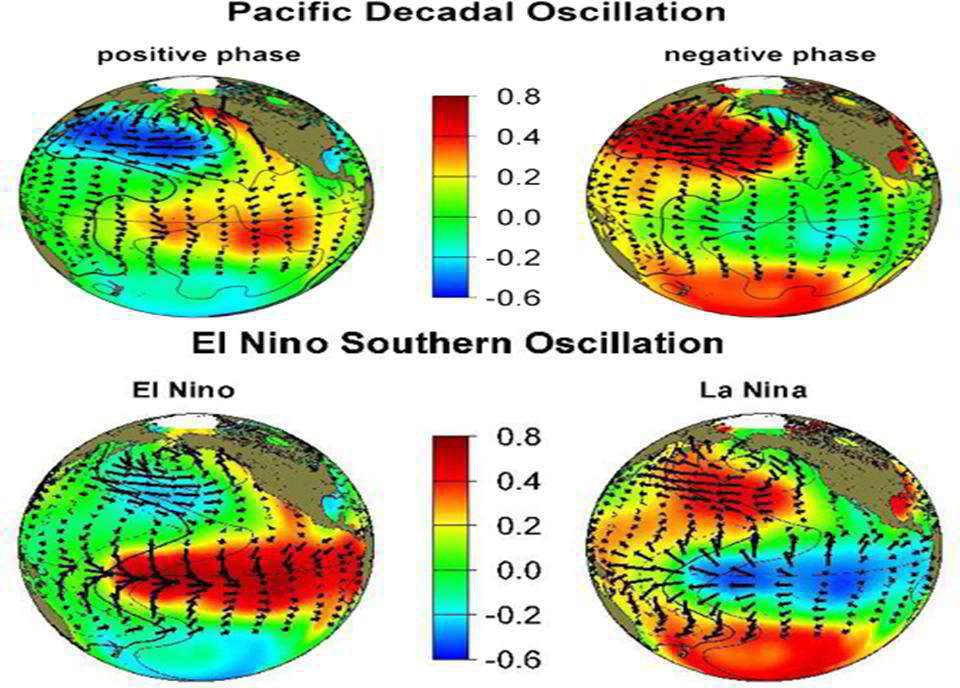
A warm/positive phase of the PDO enhances El Niño, while a negative/cool phase of the PDO enhances La Niña, while the opposite is true, i.e. if the PDO is in a positive/warm phase it will weaken an existing La Niña, or if the PDO is in a negative/cool phase it will weaken an existing El Niño. Some of the strongest El Niño’s in the last 60 years have occurred when the PDO was in a strongly positive/warm phase.
In general, the PDO strongest influence of local weather is along the West coast of the United states during the winter months.
Are you prepared for the next disaster?
Disasters can strike at a moment’s notice. That’s why, at ContactRelief, we provide round the clock disaster monitoring to keep your operations ahead of disasters. With timely, comprehensive recommendations that are accurate to the ZIP code, ContactRelief ensures you focus less on the disaster, and more on your operations.
Contact sales@contactrelief.com for more information.