Want to reach up to 5 times more contacts during a disaster?
Sign up for a free trial
Atmospheric River Brings Relief to Drought-Stricken California
Meteorologist Dr. Kevin Levey examines the drought conditions in California.
Tuesday, 10 April 2018 22:00:00 -05:00
Late Season Atmospheric River brings beneficial rains to Northern California.
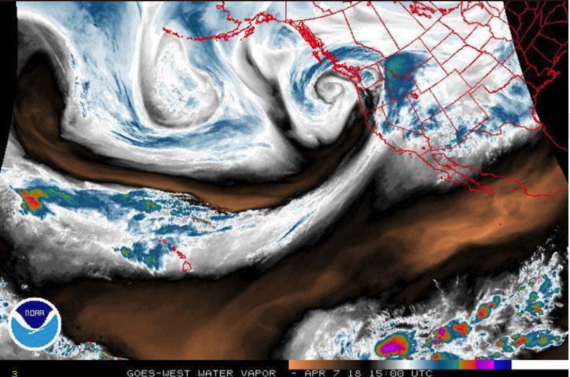
Last week I mentioned the atmospheric river that was forecast to hit Northern California. This was the third such event this year alone – the first being on 8th January, the second on March 20th . This latest one, pummeled the San Francisco Bay area for 36 continuous hours with rain and strong winds from 6PM PDT Thursday night 5th April until 6AM PDT Saturday 7th. This latest atmospheric River (AR) event can be seen extremely well on the water vapor satellite image in Figure 1 below and shows it stretching from San Francisco well west of the Hawaiian island chain.
And rain it did, in bucket loads. Thankfully, the majority of the event was associated with light to moderate rainfall rates, so the burn areas of last summer’s terrible wild fires were not affected too badly by the expected flash floods that the NWS had issued warnings for on Friday 6th. Very heavy rainfall did occur in the early hours of Saturday with minor flooding in places.
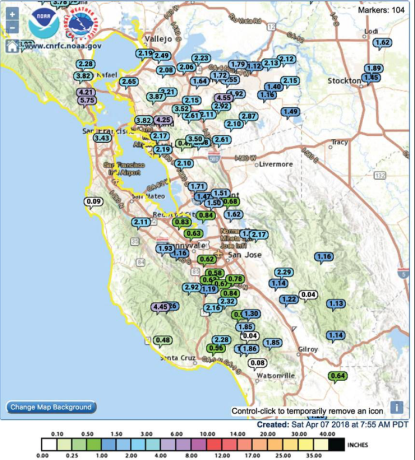
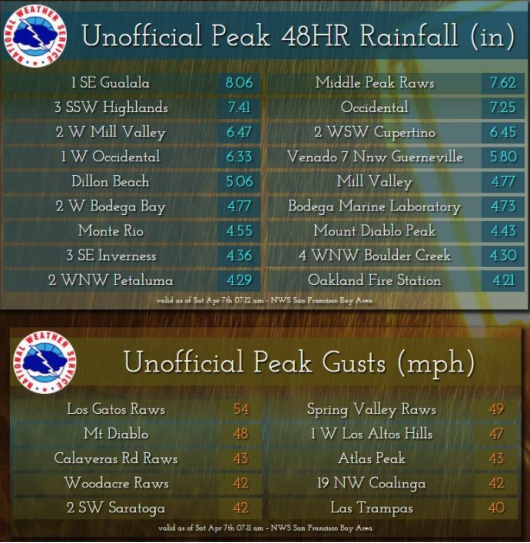
Figure 2 below shows some of the storm totals around the immediate San Francisco Bay area.
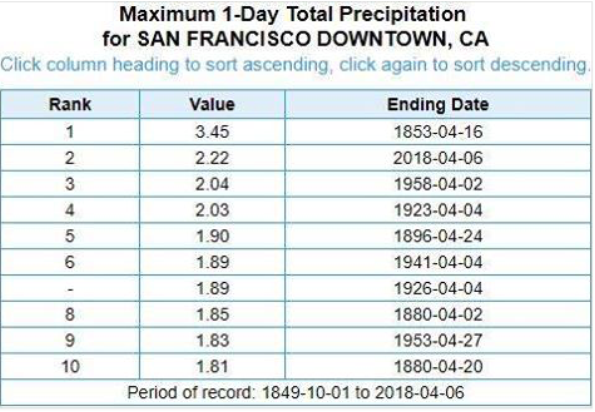
To put this atmospheric river into perspective, especially for this time of year, it was climatologically an extremely rare event – a 1 in 25 or 1 in 30 year event. Since San FranciscoDowntown has the longest continuous record in the state, the fact that the 24 hour rainfall amount in Downtown was the second greatest such April amount in the greater than 150 year history of that station is remarkable. This is shown in Figure 3 below:
However, rainfall totals elsewhere around the bay were incredible. Figure 4 below shows some of the very high rainfall totals as well as wind gusts in locations in the counties of the San Francisco Bay area:
The 2-day period of April 6-7th, was also the 10th wettest 2-day period (3.29”) for March and April since records began in 1849 in San Francisco.
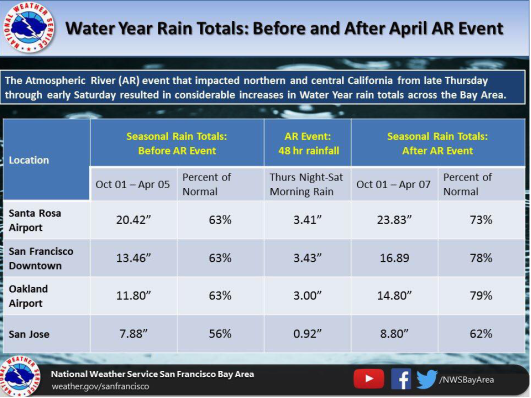
Finally, as I mentioned last week, 30-50% of California’s annual precipitation is derived from these potent atmospheric rivers and you can see below in Figure 5, just how significant the rainfall was, especially, this past winter in California where rains were absent in the months of December and February (two of the wettest months in most areas of California). Figure 5 below shows the AR increased the total water year rainfall totals by a whopping 15%. Some location’s water year totals increased from 69% of average to 89% of average. So, this event illustrates just how important atmospheric rivers are to the water cycle of the Western United States and California in particular.
The only downside of this AR was that it was a “warm” precipitation event, meaning that it brought mostly rainfall and not snowfall. Snow levels were extremely high during this event and a lot of precious snowfall was melted by this event causing minor flooding of the Truckee River and closing Yosemite National Park over the weekend owing to flooding fears from snowmelt.
Weekly Outlook:
Here is what to expect regarding precipitation and temperature in the coming week.
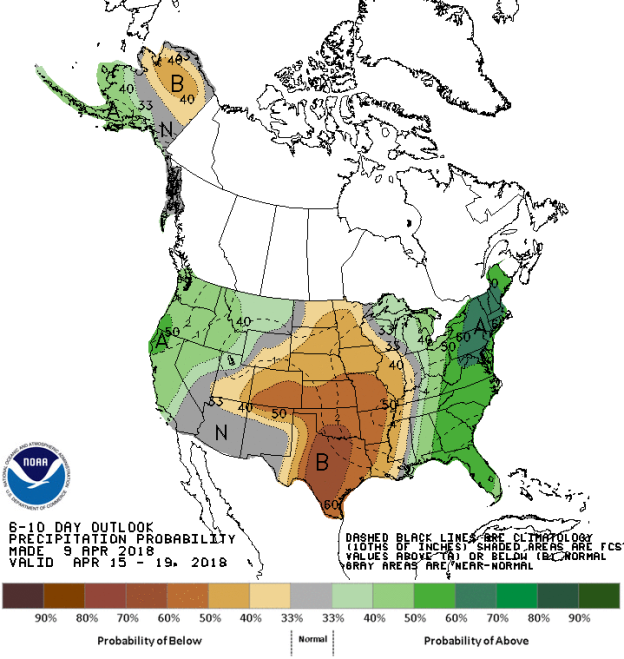
Figures 6 and 7 below show the expected 6-10-day temperature and precipitation outlooks. The colored shading on the map indicates the degree of confidence the forecaster has in the category indicated, where "B" and blue colors indicate "below-normal" and "A" and orange-red colors indicate "above normal". The darker the shading, the greater is the level of confidence. The numbers labeling the contours separating different shades gives the probability that the indicated category (A, B, or N) will occur.
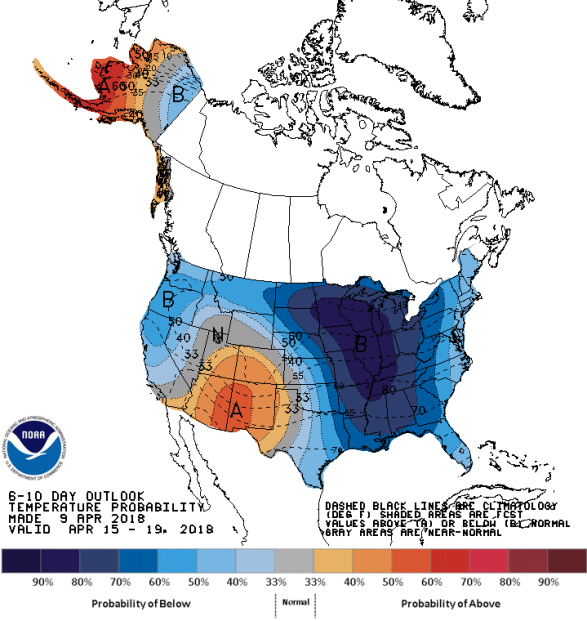
Generally, the probability of below average temperatures (as seen in Figure 6) is very high over most of the Midwest, the Ohio Valley and New England including states as far south Florida and the Gulf States. In general the entire eastern half of the country should expect below average temperatures, including the West Coast and the northern Tier States and the Pacific North West during this period. Confidence is moderate for above average temperatures over much of the Desert Southwest, and lower probabilities over far southern California, southern Utah, Colorado and far western Texas. Very few paces will experience normal temperature for this time of the year.
The precipitation outlook for the next 6-10 days (Figure 7) shows the probabilities are moderate to high for above average rainfall over much of the eastern third of the country, especially over New England and Pennsylvania. Probabilities are low to moderate for above average rainfall over much of the western United States, including Central and Northern California, Northern Nevada, and the Pacific North West, Idaho and Montana. Most of Colorado, Texas, the Central Plains States and Minnesota show a low to moderate probability of experiencing below average rainfall, but the probability is higher for below average rainfall especially over central Texas. Most of Arizona and New Mexico, southern California and southeastern Nevada should experience average precipitation for this time of the year.
Weekly hazards output by the NWS’s Climate prediction center for the next 3-7 days is shown in Figure 8 below.
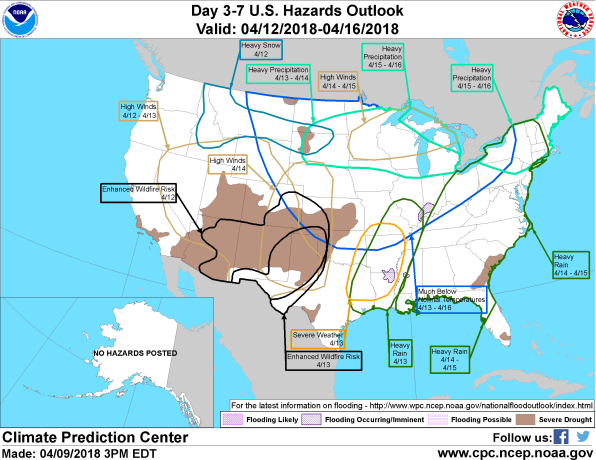
Figure 8: 3-7 Day Hazards Outlook (Courtesy: Climate Prediction Center)
Figure 4 shows that most of the expected weather hazards over the United States in the next 3 to 7 days with a lot of activity shown on the map. Heavy rainfall is expected over much of far eastern Texas, Louisiana, Arkansas, southeastern Missouri and southern Illinois on the 13th April. Heavy rainfall is also expected over much of the eastern third of the country stretching from New Orleans to New Hampshire between the 14th and 15th April. Further heavy precipitation is expected over the Dakotas into the Midwest between the 15th and 16th April. Heavy snowfall is anticipated over much of northern Idaho, Montana and parts of western South Dakota on the 12th April. Flooding is either occurring or imminent over a small area of far northeastern Louisiana and parts of southwestern Indiana. Much below temperatures are expected over much of The northern Tier States from central Montana and North Dakota southwards to northern Oklahoma and Arkansas Missouri, Kentucky and western New York, including the entire Midwest and Ohio Valley between the 13th and 16th April. High winds are expected between the 12th and 13th April over much of Nevada, the four Corner’s states and northern Texas, spreading eastwards into western Nebraska, Kansas and Oklahoma on the 13th April. Much of these same areas will experience enhanced wildfire risks between the 12th and 13th April. High winds may also occur between the 14th and 15th April over much of southern Minnesota, Wisconsin and northern Michigan. Severe weather is possible over far eastern Texas, northern Louisiana, Arkansas and far southern Missouri on the 13th April.