NOAA releases next-generation polar-orbiting satellite!
Meteorologist Dr. Kevin Levey looks at satellite weather monitoring
Wednesday, 27 June 2018 08:50:00 -05:00
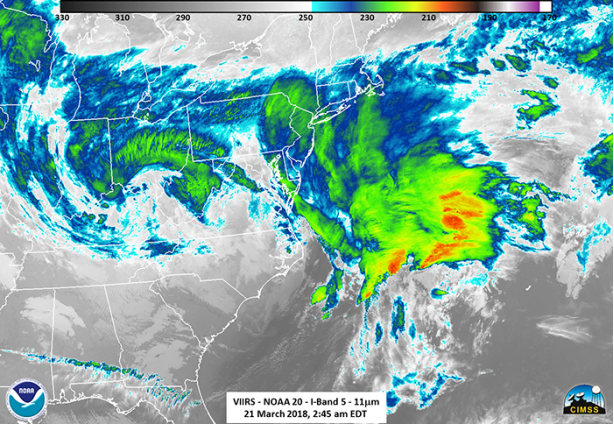
Launched last November as JPSS-1 and renamed NOAA-20 once it reached orbit, the satellite features the latest and best technology NOAA has ever flown in a polar orbit to capture more precise observations of the world’s atmosphere, land and waters. Data from the satellite’s advanced instruments will help improve the accuracy of 3-to-7 day forecasts.
NOAA-20 provides NOAA’s National Weather Service with global data for numerical weather prediction models used to develop timely and accurate U.S. weather forecasts. In addition, high-resolution imagery from the satellite’s Visible Infrared Imaging Radiometer Suite, known as VIIRS, will enable the satellite to detect fog, sea-ice formation and breaking in the Arctic, volcanic eruptions and wildfires in their very early stages. This advanced modeling and imagery information, shared with international and governmental partners, will help businesses, the emergency preparedness and response communities and individuals make the best decisions possible in the face of weather-related hazards.

NOAA-20 joins Suomi NPP – the NOAA-NASA demonstration satellite launched in 2011 – giving the U.S. the benefit of two sophisticated spacecraft in nearly the same orbit. Each circles the Earth in a polar orbit 14 times a day, collecting global observations that form the basis for U.S. weather prediction.
“NOAA-20 is especially beneficial for tracking developing storms in the Arctic, Alaska and Antarctica. Forecasts for these remote regions are critical for the U.S. fishing, energy, transportation and recreation industries, which operate in some of the harshest conditions on the planet,” said Neil Jacobs, Ph.D., assistant secretary of commerce for environmental observation and prediction.
JPSS-2, the second in the series, is scheduled to be launched in 2021, followed by JPSS-3 in 2026 and JPSS-4 in 2031. JPSS satellites are designed to operate for seven years, with the potential for several more years. The JPSS mission will deliver its critical data and information for at least the next two decades to support a Weather-Ready Nation.
Weekly Outlook:
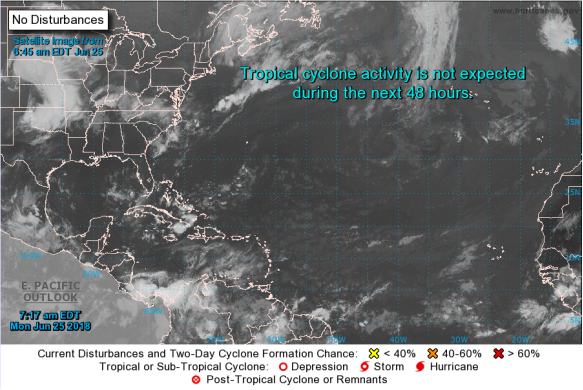
The Atlantic continues to be halfway into June with no development expected as seen in Figure 3 below. No tropical threats currently exist in the Gulf of Mexico or anywhere in the Atlantic Ocean as is mostly typical for the first month of the hurricane season. Looking towards the upcoming week, no tropical threats are forecast to develop or enter the Gulf of Mexico over the next seven days. In fact, the quiet conditions currently being observed across the entire Atlantic are expected to persist through the beginning of next week.
Here is what to expect regarding precipitation and temperature in the coming week.
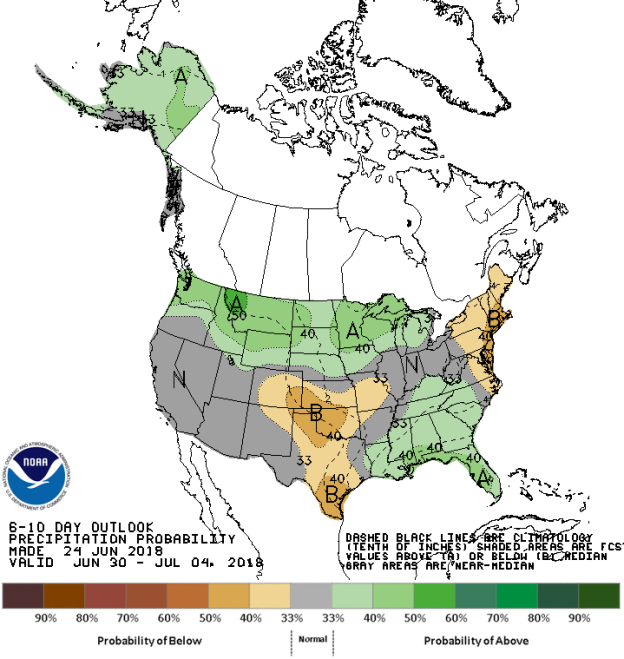
Figures 4 and 5 below show the expected 6-10-day temperature and precipitation outlooks. The colored shading on the map indicates the degree of confidence the forecaster has in the category indicated, where "B" and blue colors indicate "below-normal" and "A" and orange-red colors indicate "above normal". The darker the shading, the greater is the level of confidence. The numbers labeling the contours separating different shades gives the probability that the indicated category (A, B, or N) will occur.
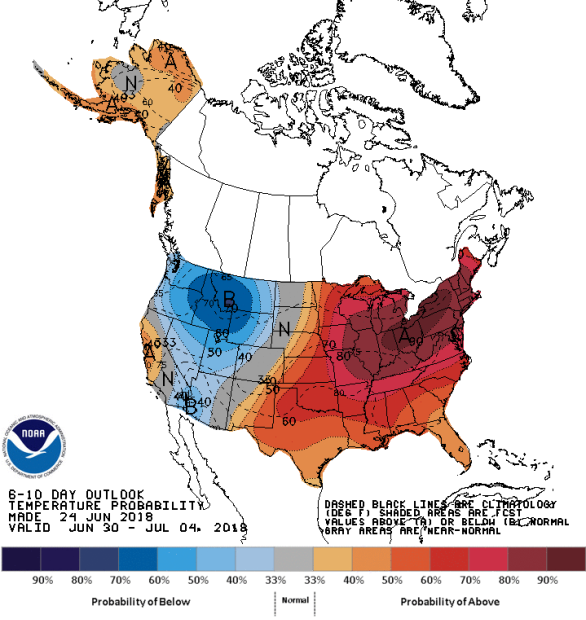
Generally, the probability of below average temperatures (as seen in Figure 4) is moderate over most of the Idaho and western Montana region, with lower probabilities over much of the Pacific Northwest, Nevada, Utah and western Arizona. In general the probability is moderate to high that the entire eastern half of the country will experience above average temperatures, centered on the Ohio Valley stretching into western New England. The central coastal regions of California and much of Alaska should also expect low to moderate probabilities of above average temperatures. Much of western Central and Northern tier states, and eastern Arizona and western New Mexico should experience normal temperature for this time of the year.
The precipitation outlook for the next 6-10 days (Figure 5) shows the probabilities are low to moderate for below average rainfall over much Texas, Oklahoma, western Colorado, southern Kansas and Missouri, and also much of New England southwards into the coastal regions of Virginia. Moderate probabilities for above average rainfall exists over most of Alaska, Washington, the Northern Tier States from Idaho through the upper Midwest. Much of the southeast form the Tennessee Valley southwards into Florida should also see low to moderate probabilities for above average rainfall. Most of California, southern Oregon, Arizona, most of New Mexico and much of the Ohio Valley should experience average rainfall for this time of the year.
Weekly hazards output by the NWS’s Climate prediction center for the next 3-7 days is shown in Figure 6 below.

Figure 6 shows that most of the expected weather hazards over the United States in the next 3 to 7 days. Heavy rains are expected over parts of the Midwest from northern Missouri through central Minnesota and Wisconsin, Iowa and much of the northern half of Illinois between the the 25th and 26th June. (Most of this area has the potential for flooding). Much above normal temperatures can also be expected between 25th and 26th June over a large part of the central Northern California, over much of the southern and central Mississippi River Valley between the 25th and 29th June and also over much of the southern from Louisiana, eastwards into northern Florida and northwards into southern Virginia between the 28th and 29th. High winds can be expected on the 25th June over much of western and northwestern Texas, Oklahoma and southern Kansas.
Are you prepared for the next disaster?
Disasters can strike at a moment’s notice. That’s why, at ContactRelief, we provide round the clock disaster monitoring to keep your operations ahead of disasters. With timely, comprehensive recommendations that are accurate to the ZIP code, ContactRelief ensures you focus less on the disaster, and more on your operations.
Contact sales@contactrelief.com for more information.