
Death in Death Valley
Meteorologist Dr. Kevin Levey explains Death Valley's Recording Setting Heatwave
Wednesday, 22 August 2018 06:15:00 -05:00
The July 2018 mean average temperature for the contiguous U.S. was 75.5°F, 1.9°F above the 20th century average. However, California had its hottest July and hottest month on record at 79.7°F, surpassing the previous record set in 1931. So it comes as no surprise then that in Death Valley, California, the temperatures were so extreme in July that they set a new record for the hottest month ever known to have been reliably measured at any station on Earth with an average temperature of 108.1°F being recorded (see Figure 2 below). This beats the previous U.S. for all-time hottest month, also set in Death Valley last year July at 107.4°. It also beats the previous world record of 107.8°F set in July 2017 at Dehloran, Iran, according to weather records expert Maximiliano Herrera.
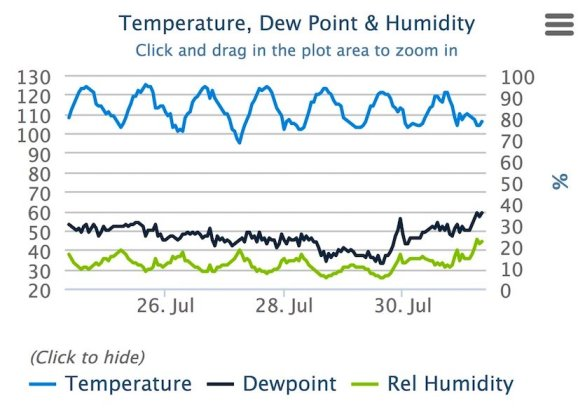
The week of July 24 – 30, 2018 was the second hottest week on record for Death Valley (see Figure 3 above). Only the week of June 28 - July 4, 2013 was hotter. Here are the temperatures recorded at Death Valley during the week of July 24 – 30, 2018; an asterisk* indicates a daily record beaten or tied. During this week, the average high was 125.6°F, the average low was 99.3°F, and the average temperature was 112.4°F:
DATE
MAX
MIN
7/24 127°F * 95°F
7/25 127°F * 102°F *
7/26 127°F * 100°F
7/27 127°F * 94°F
7/28 124°F 101°F *
7/29 124°F 100°F
7/30 123°F 103°F*
The four consecutive days of 127°F is in second place for the longest such stretch on record at Death Valley. Excluding the unreliable July 1913 data, only a June - July 2013 event beat that, with five such days in a row. Also, daily records for warmest minimum temperature were set on these dates in 2018:
6/25: 97° F
7/09: 103°F
7/17: 102°F
7/18: 103°F
7/31: 103°F
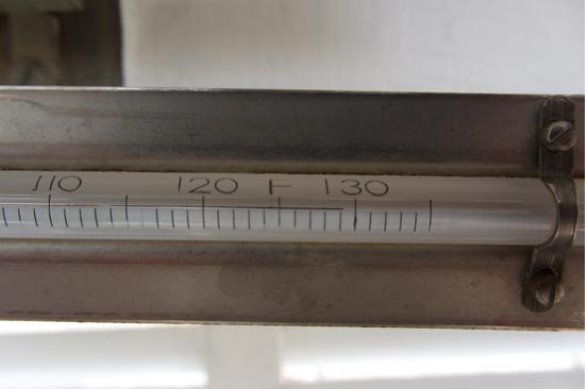
Death Valley recorded Earth's hottest reliably measured temperature on record on June 30, 2013, when the mercury hit 129.2°F ( Figure 4 above). This record was tied on July 21, 2016 when a temperature of 129.2°F was also recorded at Mitribah, Kuwait. The only higher temperatures ever officially recorded on the planet were measured in Death Valley: July 10, 12, and 13, 1913, when 134°F, 130°F, and 131°F were recorded. This 105-year-old record heat wave has many doubters, though, including weather historian Christopher Burt, who noted in a 2010 blog post that "The record has been scrutinized perhaps more than any other in the United States. I don't have much more to add to the debate aside from my belief it is most likely not a valid reading when one looks at all the evidence. Normally when Death Valley records its hottest temperatures they occur during region-wide heat waves. On July 10, 1913, the next highest temperatures recorded in southern California (aside from Greenland Ranch) were just 119° at Heber and 118° at Mammoth Tank." If Burt is correct, the 129.2°F in Death Valley in 2013 and in Kuwait in 2016 are the hottest temperatures in recorded history on Earth. (The official second hottest place in the U.S. is Lake Havasu City, AZ, which recorded 128° on June 29, 1994, but Burt says that record is questionable, as are some obviously bogus readings from sites like Salton, CA in the 1880s of 130°).
Yes, more sizzzzle…….
Weekly Outlook:
Here is what to expect regarding precipitation and temperature in the coming week.
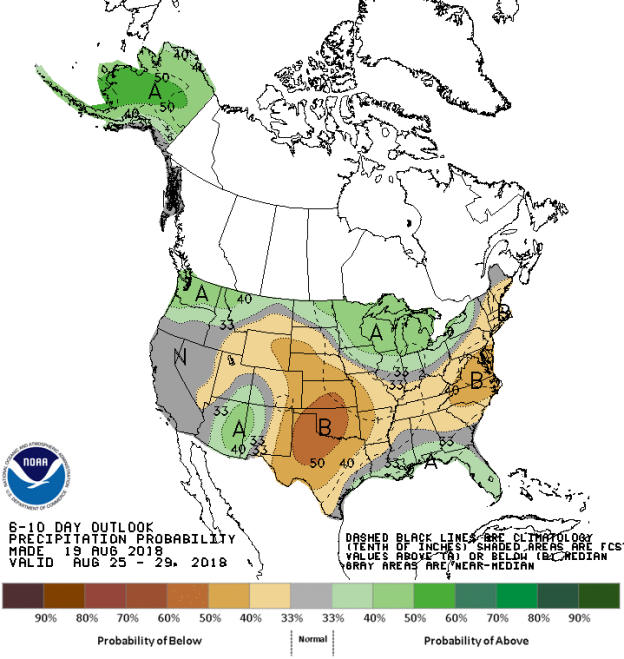
Figures 5 and 6 below show the expected 6-10-day temperature and precipitation outlooks. The colored shading on the map indicates the degree of confidence the forecaster has in the category indicated, where "B" and blue colors indicate "below-normal" and "A" and orange-red colors indicate "above normal". The darker the shading, the greater is the level of confidence. The numbers labeling the contours separating different shades gives the probability that the indicated category (A, B, or N) will occur.
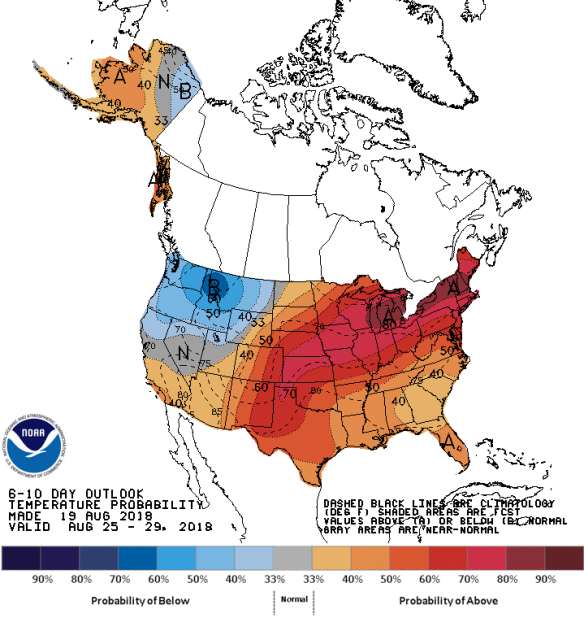
Generally, the probability of below average temperatures (as seen in Figure 5) is moderate to high over much of the Pacific Northwest, centered on Northern Idaho and far western Montana and the extreme eastern parts of Alaska. In general the probability is moderate to high that the eastern two-thirds of the country will experience above average temperatures, centered on the Midwest stretching into New England, but still high over much of the Central Plain states and the northern Mississippi River valley. The chances for a bove average temperatures is also high over southern California, much of eastern Alaska and Arizona. Very few areas outside these two above/below average temperatures will experience normal temperatures for this time of the year.
The precipitation outlook for the next 6-10 days ( Figure 6) shows the probabilities are low to moderate for below average rainfall over much of Texas and Oklahoma, stretching eastwards into the MidAtlantic and New England coastal areas. the Pacific Northwest, extreme southeastern Texas and the southern half of Florida. Low probabilities for above average rainfall exists over Alaska, the Pacific Northwest, much of the Midwest and much of the coastal areas of the Deep South and Florida. Most of California Nevada should experience average rainfall for this time of the year.
Weekly hazards output by the NWS’s Climate prediction center for the next 3-7 days is shown in Figure 7 below.
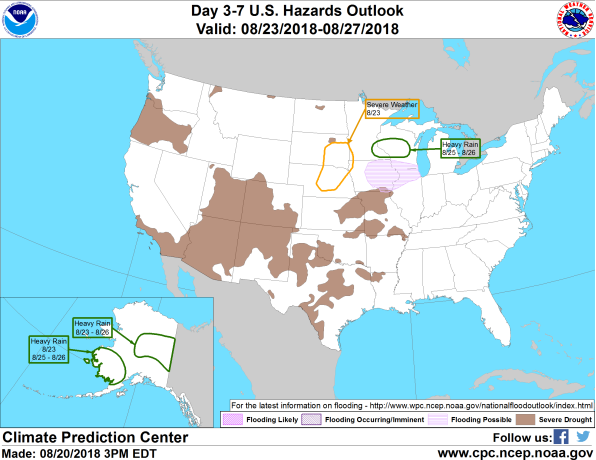
Figure 7 shows that most of the expected weather hazards over the United States in the next 3 to 7 days. Heavy rain should be expected over the central parts of Northern Wisconsin and far southeastern Minnesota between the 25 th and 26 th August. Heavy rains are also expected between the 23 rd and 26 th August over much of central eastern Alaska, and between the 25 th and 26 th August over southwestern Alaska. Flooding is possible during this period over much of eastern Iowa and far northern Illinois and far southern Wisconsin. Severe weather can also be expected over parts of northeastern Nebraska and southeastern South Dakota on the 23 rd August.