
Hurricane Lane - Honolulu NWS Gets It Right
Meteorologist Dr. Kevin Levey explains how the forecasters at Honolulu NWS made the correct call for Hurricane Lane
Tuesday, 28 August 2018 05:42:00 -05:00
Tropical Outlook:
After a few tense hours late last week as major Hurricane Lane (which was a category 5 hurricane at one time), Hawaii was spared the brunt of a landfalling major hurricane. Hurricane Lane has weakened to a tropical depression and is now located well to the west of the main island chain. The outer rain bands of Lane are still bringing scattered rainfall to Hawaii this morning, however this rainfall is expected to diminish throughout the day as Lane continues to move westward towards the open ocean. (More about Lane in the main body of this post).
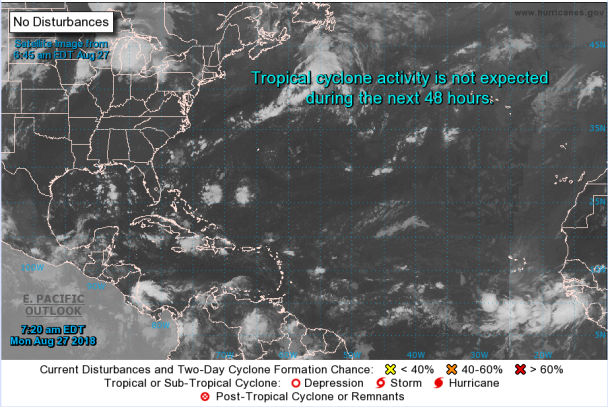
The Atlantic Ocean, a full week of inactivity was observed once again, as no tropical systems developed throughout the week in the entirety of the basin. The Gulf of Mexico itself is calm once again this morning, with mostly clear conditions prevalent along the vast majority of the Gulf Coast and no tropical systems currently threatening to develop in or around the region.
Looking ahead at the upcoming week, another quiet week is expected for the Gulf Coast, with no tropical threats forecast to develop over the next seven days. The Atlantic Ocean as a whole will likely see no tropical development once again this week (as seen in Figure 1), with only a small chance of a weak tropical system developing in the far-eastern Atlantic during the latter half of the week. If this system were to develop however, it would not be expected threaten any landmasses throughout its lifespan.
Hurricane Lane – NWS Honolulu does an excellent job!
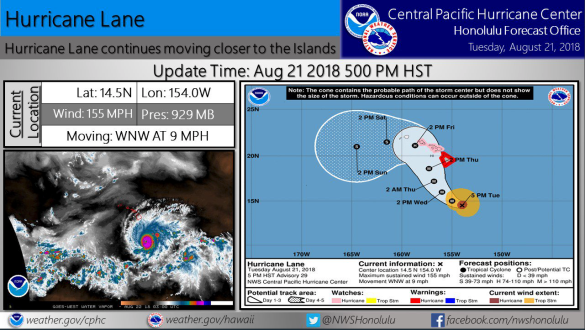
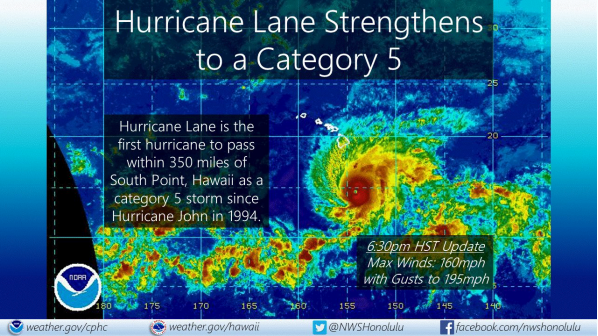
Early last week residents in Hawaii suddenly took notice of an impending major category 5 hurricane bearing down on the island chain ( Figure 2 below) as Hurricane Lane was upgraded to a category 5 hurricane with sustained winds over 160mph and gusts of up to 195mph at 6:30PM HST ( Figure 3 below). The forecast track issued 90minutes earlier showed that the hurricane was expected to move northwards with potential of landfall on Maui or Oahu.
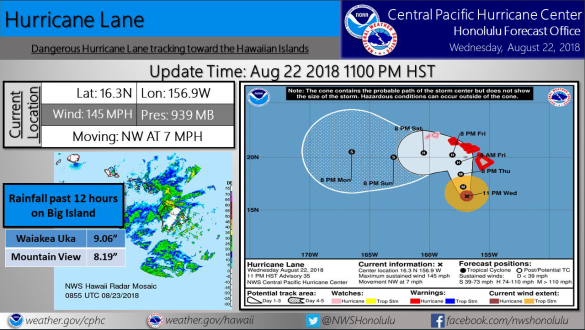
By 11pm on WED parts of the big Island had already measured over 9” of rain and Lane was still well south of the island chain, but had thankfully been downgraded to a strong category 4 with sustained winds of 145mph. The forecast track (see in Figure 4 below) continued to track Lane northwards towards Oahu, but the good news was that the intensity was expected to dish as it moved over cooler waters further north.
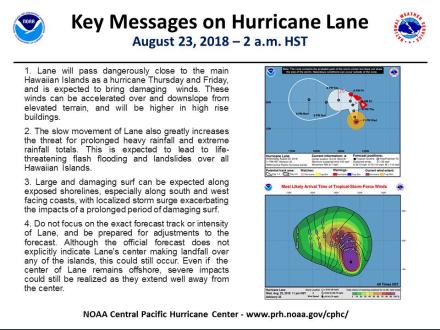
As the hurricane moved closer to the islands, the NWS Honolulu office issued the following warnings at 2AM HST.
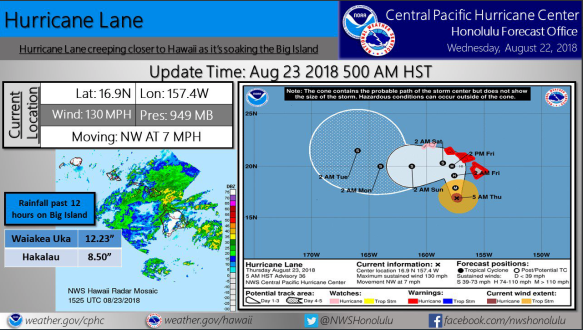
Three hours later at 5AM HST, the hurricane had further weakened to a category 3 with sustained winds of 130mph and the latest track shown in Figure 6 (below) with a sharp turn to the west and therefore not making landfall in Oahu or any of the other islands. Parts of the Big Land had already measured over a FOOT of rain by this time (Waiakea Uka measured 12.23”). As the hurricane moved closer, it was very clear to the forecasters at the NWS Honolulu office that winds were not going to be the major impact from Lane, but rather, flooding rains. Numerous flash flood and regular flood warnings were issued during the day on Thursday 23 rd and Friday 24 th.
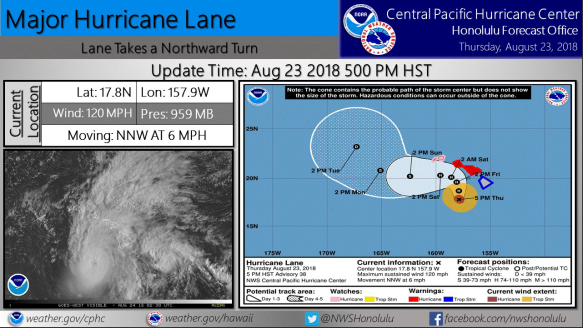
As predicted, Lane had weakened further by the 5PM issued hurricane advisory with very little change in the track expected as seen in Figure 7 (below). Strongest wind gusts by 5pm were as follows:
Big Island:
- Kohala Ranch: 67mph
- Kawaihae: 64mph
MaPui:
- Lahaina: 49mph
Oahu:
- Kawailoa: 51mph
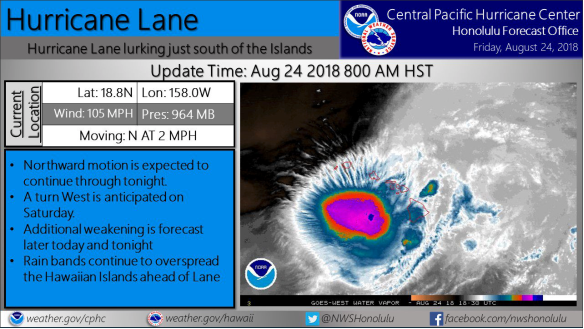
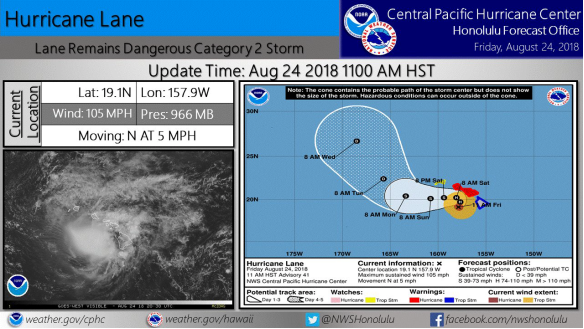
By 8am on FRI as Lane was the closest it was every going to be to any of the Hawaiian Islands ( Figure 8 below), it was located exactly where forecasters had predicted and had weakened further with sustained winds near the eye of 105mph, but it was moving extremely slowly northwards at 2mph which certainly allowed the rainfall totals to rapidly accumulate, especially on the eastern flanks of the Big Island where topography dramatically exacerbates large rainfall totals.
Over the next 3 hours Lane continued to be ripped apart by strong upper-levels winds known as wind-shear which provides an extremely hostile environment for hurricanes, not to mention the much cooler ocean surface temperatures which also helped weaken Lane with less fuel to intensify the hurricane. It was now a category 2 hurricane and weakening rapidly. ( Figure 9 below)
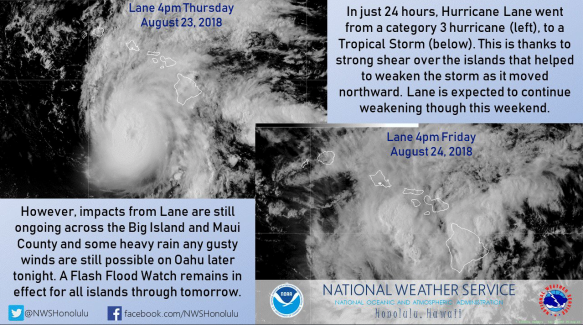
This rapid weakening was captured in the satellite images shown below in Figure 10.
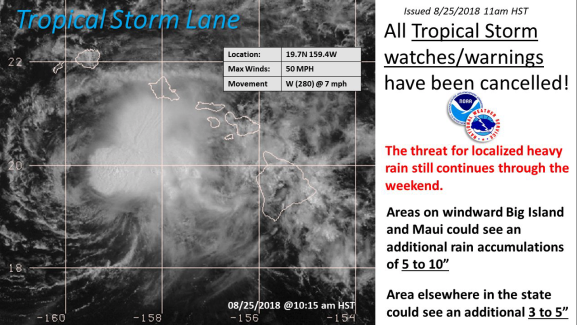
By 8AM on SAT 25 th, Lane was downgraded to a tropical storm. ( Figure 11 below)
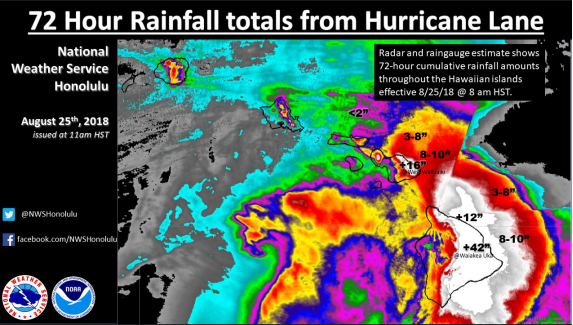
Radar estimated rainfall totals over the 72-hour period ending at 11AM HST on the 25 th August showed some astounding rainfall totals as seen in Figure 12 below.
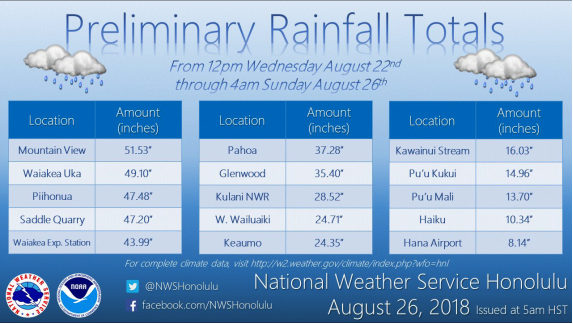
Preliminary rainfall measurements from the Big Island of Hawaii over the last four days, associated with former Hurricane Lane , have produced the third highest storm total rainfall from a tropical cyclone in the US since 1950. Figure 13 below shows totals for Big Island and Maui.
Weekly Outlook:
Here is what to expect regarding precipitation and temperature in the coming week.
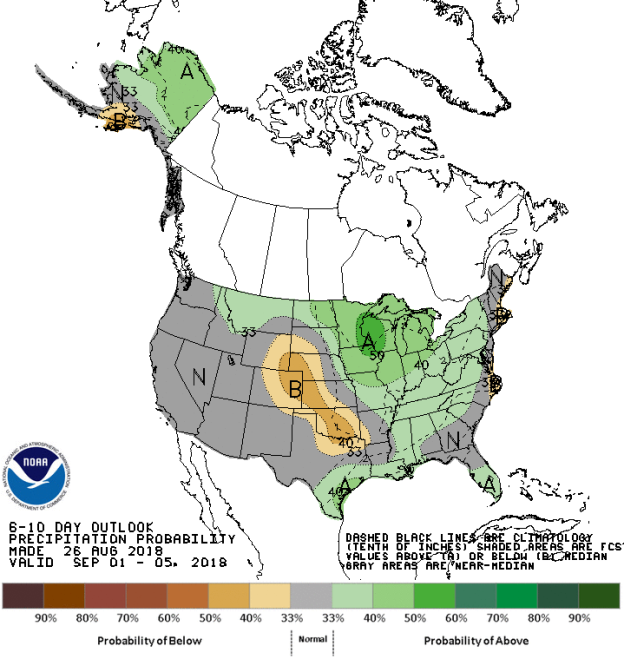
Figures 14 and 15 below show the expected 6-10-day temperature and precipitation outlooks. The colored shading on the map indicates the degree of confidence the forecaster has in the category indicated, where "B" and blue colors indicate "below-normal" and "A" and orange-red colors indicate "above normal". The darker the shading, the greater is the level of confidence. The numbers labeling the contours separating different shades gives the probability that the indicated category (A, B, or N) will occur.
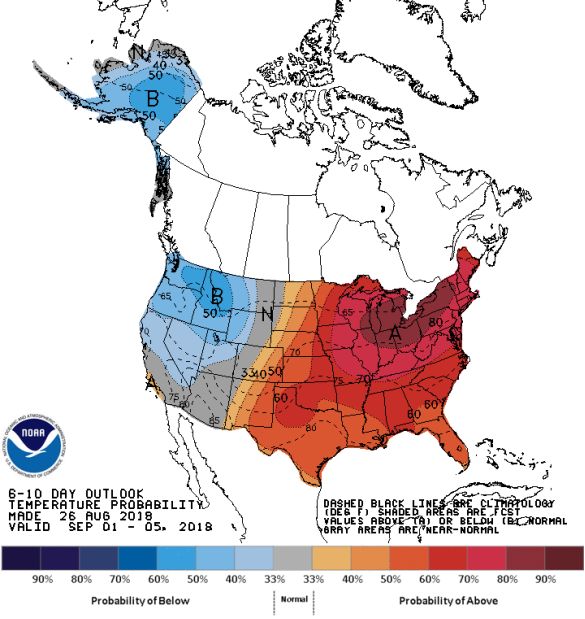
Very similar patterns to last week. Generally, the probability of below average temperatures (as seen in Figure 14) is low to moderate over much of the Pacific Northwest, centered on the Seattle area stretching eastwards over northern Idaho, western Montana and most of Alaska. In general the probability is moderate to high that the eastern two-thirds of the country will experience above average temperatures, centered on the northern Ohio Valley stretching into New England, but still high over much of the Central Plain states and the northern Mississippi River valley. The chances for a bove average temperatures is also moderate over southern California, much of Arizona and New Mexico. Apart from the Pacific Northwest, the western third north of the four corners and southern California will experience normal temperatures for this time of the year.
The precipitation outlook for the next 6-10 days ( Figure 15) shows the probabilities are low to moderate for below average rainfall over much of the Pacific Northwest, northern Idaho and western Montana. Low probabilities for above average rainfall exists over Alaska, much of the Midwest and Ohio Valleys, southeastern Texas and the southern half of Florida. All remaining areas should experience average rainfall for this time of the year.
Weekly hazards output by the NWS’s Climate prediction center for the next 3-7 days is shown in Figure 16 below.
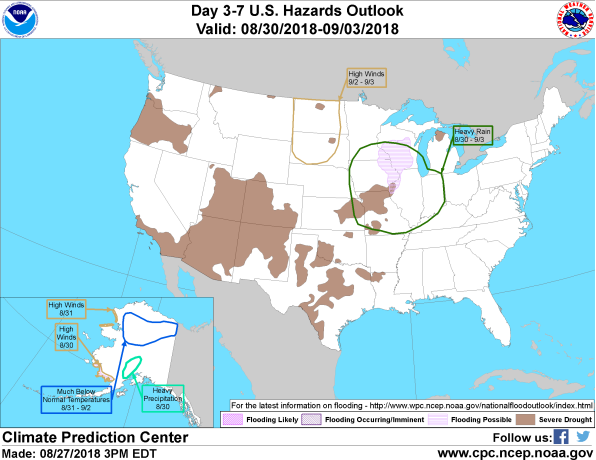
Figure 16 shows that most of the expected weather hazards over the United States in the next 3 to 7 days. Heavy rain should be expected over the northern Mississippi River valley, including much of Missouri, Illinois, Iowa, southern Minnesota and Wisconsin and Indiana between 30 th Aug and 3 rd Sep. High winds can be expected between the 2 nd and 3 rd Sep over both North and South Dakota. Heavy precipitation is also expected on the 30 th August over a small area of southern Alaska northwest of Anchorage. Much below normal temperatures should be expected between the 31 st Aug and 2 nd Sept over much of northern interior of Alaska. High winds can also be expected over parts of the western coastline of Alaska on the 30 th and 31 st of Aug. Flooding is possible during this period over much of eastern Iowa and southern Wisconsin.