Firenado! A Fire Tornado?
Meteorologist Dr. Kevin Levey explains the Firenado - Hell on Earth in a Fire Tornado
Wednesday, 05 September 2018 09:00:00 -05:00
Wildfires have become prominent news items over the past few years, but this year, the wildfire season got off to an early and devastating start, especially in California. With one of the hottest July’s on record in Redding and with years of drought having killed off many trees in Northern California, the stage was set for what can only be described as a major firestorm catastrophe.
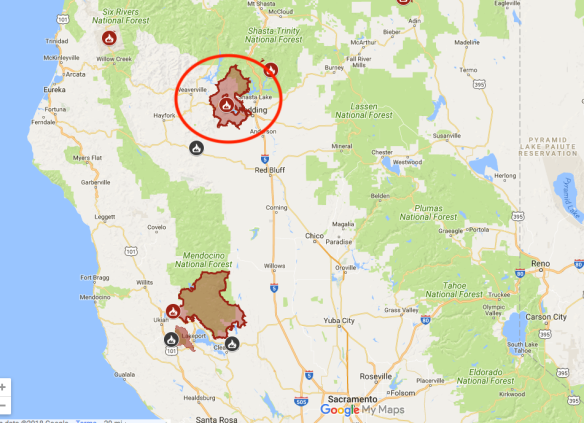
The Carr Fire started on Monday 23rd July around 1:15PM quite innocently enough – a car had broken down and had caught fire in far eastern Trinity County about 20 miles west of Redding, CA located in the northern end of the Central Valley of California (see Figure 1 below).
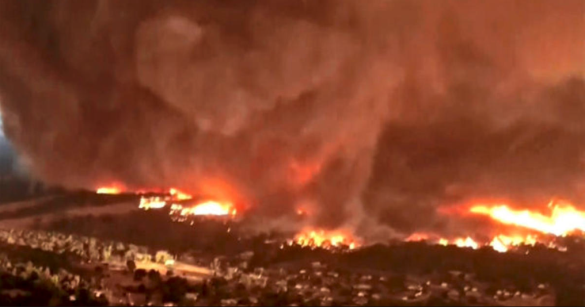
The fire grew rapidly and raced eastwards into Shasta County towards Redding where it entered the western suburbs of Redding later on Thursday, 26th July. It wasn’t until after the weekend that it came to light that a “fire tornado” had occurred between about 7:30 and 8:00 pm PDT Thursday night, July 26, a tornado-like vortex developed along the fire front just a few miles north of downtown Redding. According to a preliminary survey led by the National Weather Service and CAL FIRE’s Serious Accident Review Team (SART), the vortex produced surface winds that exceeded an astonishing 143 mph, making it the equivalent of an EF3 tornado on the Enhanced Fujita Scale. Figure 2 (below) shows that very rare phenomenon. Craig Clements, director of San Jose State University’s Fire Weather Research Laboratory described this event as “This is historic in the U.S. This might be the strongest fire-induced tornado-like circulation ever recorded.”
Before I discuss what a “fire tornado” is, let’s first see what the more common “fire whirl” is. The term “fire whirl” usually refers to brief spin-ups that are fairly common along the leading edges of large, intense forest fires. Driven by the buoyancy of the fire-heated air, and the contrast between the fire plume and the adjacent ambient air, these whirls can be dramatic, but they’re usually quite modest in scale: typically 30 to 150 feet tall, 10 to 50 feet wide, and lasting only a few minutes. What occurred that Thursday night in Redding was far, far more intense than a “fire whirl” and has been called a “fire tornado”.
The American Meteorological Society defines a tornado as “a rotating column of air, in contact with the surface, pendant from a cumuliform cloud, and often visible as a funnel cloud and/or circulating debris/dust at the ground.”
Fire whirls can extend hundreds of feet from the ground, but they aren’t typically connected to a cumulus-type cloud higher up. This makes sense: Because the weather driving the worst wildfires is normally hot and dry, the air would have to rise thousands of feet above the surface in order to condense moisture and form the base of a cumuliform cloud.
The main opportunity for a cloud base and a fire whirl to connect would be in a pyrocumulus, the billowing clouds that sometimes erupt above wildfires at their most intense. Pyrocumulus can sometimes grow large and strong enough to produce pockets of oppositely charged particles, a key stepping stone to lightning—in which case the cloud becomes a pyrocumulonimbus (a fire-generated thunderstorm). Figure 5 shows the massive pyrocumulus associated with the Carr Fire over Redding.
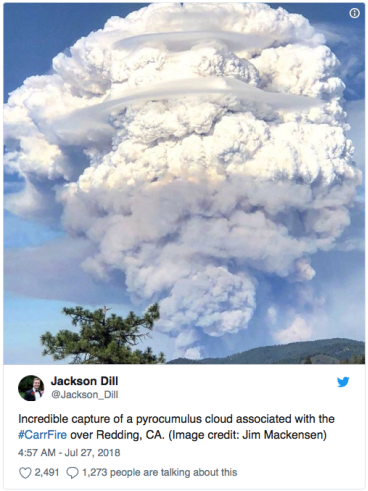
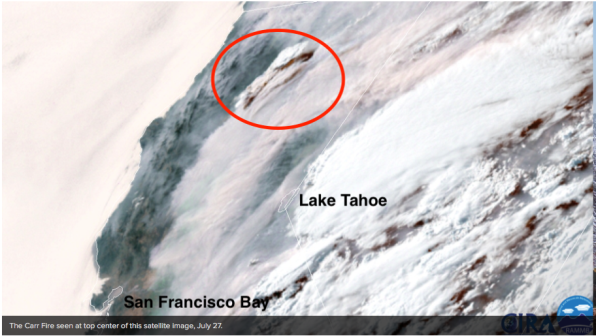
Figure 4 below shows that this massive pyrocumulus cloud was still clearly seen from space on Friday 27th July.
Neil Lareau, an assistant professor at the University of Nevada, Reno, has given an explanation for this “fire tornado”, essentially calling it a very intense landspout, which is a type of non-supercell tornado (and a land-based analogue to a waterspout). So, how did it form?
The tornado formed as the blaze, which has already charred an area three times as large as the District of Columbia, erupted and began to rotate like a supercell thunderstorm. Initially, the smoke plume reached about 20,000 feet. That’s not overly impressive for a thunderstorm, but it couldn’t rise any higher: It was trapped beneath an inversion.
That “cap” in the atmosphere caused the smoke to spread out. But around 7:15 p.m. Pacific time, two plumes suddenly managed to break the cap. They rose into an unstable environment and exploded upward, towering to nearly 40,000 feet within 30 minutes. That extreme, rapid vertical growth of the fire fueled an updraft that eventually would spawn the tornado.
On 2nd August, the National Weather Service estimated the fire-induced tempest packed winds in excess of 143 mph. Such wind strength is equivalent to an EF3 tornado, on the 0-to-5 scale for twister intensity.
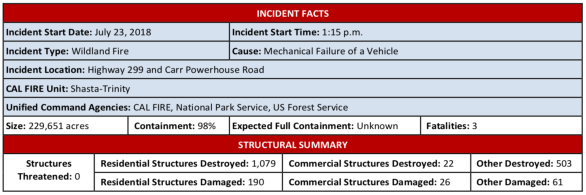
To conclude, as of the 30th August, the Carr Fire has burned 229,651 acres and is 98% contained. Three people lost their lives unfortunately. Figure 7 below shows more statistics for this fire.
Weekly Outlook:
Here is what to expect regarding precipitation and temperature in the coming week.
Figures 6 and 7 below show the expected 6-10-day temperature and precipitation outlooks. The colored shading on the map indicates the degree of confidence the forecaster has in the category indicated, where "B" and blue colors indicate "below-normal" and "A" and orange-red colors indicate "above normal". The darker the shading, the greater is the level of confidence. The numbers labeling the contours separating different shades gives the probability that the indicated category (A, B, or N) will occur.
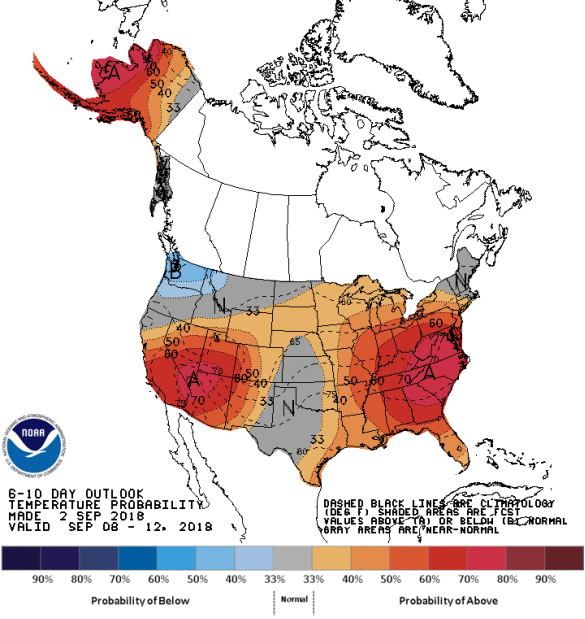
Generally, the probability of below average temperatures (as seen in Figure 8) is low over much of the Pacific Northwest, centered on the Seattle area. In general, the probability is moderate to high that the eastern half of the country will experience above average temperatures, centered on the Mid-Atlantic stretching into southern New England to Florida and westwards as far as the eastern Plains states. The chances for above average temperatures is also moderate over southern California, much of Arizona and New Mexico and almost all of Alaska. Much of Texas and the Southern and Central Plains states, Oregon, Montana, and northern North Dakota will experience normal temperatures for this time of the year.
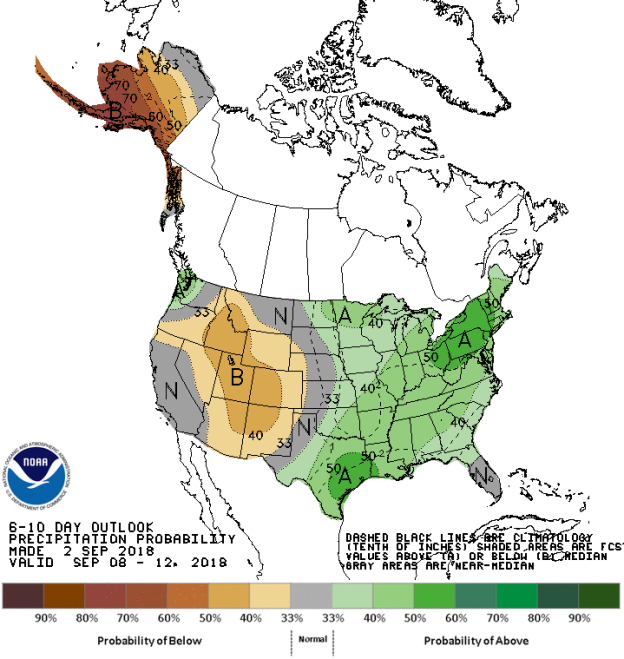
The precipitation outlook for the next 6-10 days (Figure 7) shows the probabilities are low to moderate for below average rainfall over much of the western interior, centered on Idaho, Utah, western Colorado, and New Mexico as well as much of Alaska. Moderate probabilities for above average rainfall exists over much of the eastern half of the country, including the Midwest and Ohio Valleys and southeastern Texas. All remaining areas should experience average rainfall for this time of the year.
Weekly hazards output by the NWS’s Climate prediction center for the next 3-7 days is shown in Figure 8 below.
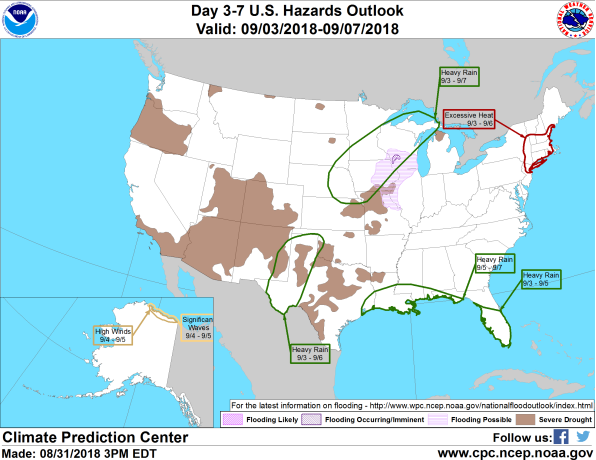
Figure 8 shows that most of the expected weather hazards over the United States in the next 3 to 7 days. Heavy rain should be expected over the southern portions of Florida as Tropical Storm Gordon moves through the area between the 3rd and 5th Sep and between the 5th and 7th over much of the Gulf Coast from the Florida Panhandle to Houston. Heavy rain is also expected over much of western Texas and far eastern New Mexico between the 3rdand 6th Sep. Heavy rain can also be expected over a large area stretching from eastern Nebraska through Iowa, southern Minnesota and Wisconsin the U.P. of Michigan between the 3rd and 7th Sep. Excessive heat should be expected over parts of New England including Massachusetts, far eastern New York, southern New Hampshire and Vermont between the 3rd and 6th Sep. High winds and significant waves can be expected between the 4th and 5th along the northern coast of Alaska. Flooding is possible during this period over much of eastern Iowa, southern Wisconsin, and far northwestern Illinois.
Get in touch
Shaping your outbound contact away from disaster stricken areas isn't just the right thing to do, it's smart business. To learn more about how ContactRelief can help you protect your brand, reduce your risk of adverse actions, and improve your contact center efficiency, click below to contact us.
Contact us