'The Day after Tomorrow' will bring record breaking cold.
The Polar Vortex is here. ContactRelief meteorologist Dr. Kevin Levey tells what to expect from this record setting cold.
Monday, 28 January 2019 07:45:00 -06:00
If you have seen the movie “The Day after Tomorrow” you know it was about the cold. Three weeks ago, I mentioned the atmospheric event referred to as “Sudden stratospheric Warming” or SSW which tends to both precede and be a good indicator of cold weather outbreaks over Europe and the USA. Last week we had forewarning of the impending cold outbreak in the weekly outlook. Well, thanks to the “Polar Vortex”, the Northern Plains and parts of the Midwest are already experiencing bitterly cold conditions which are only expected to get worse by Wednesday and Thursday over large parts of the northern and northeastern areas of the USA. Over 20 cities could break low-temperature records this coming week.
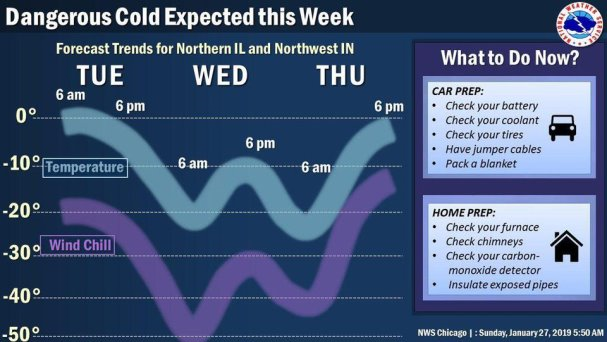
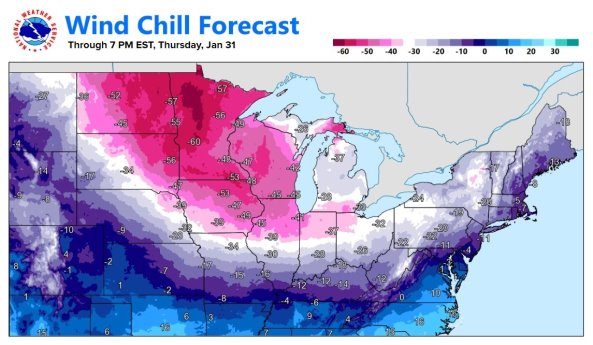
The cold has already invaded the Northern Plains where it was -46°F in International Falls, MN on Sunday, which ties the 5th coldest temperature in station history and -40°F in Hibbing, MN, which was the 11th coldest in station history. Yes, it’s winter and these places typically do get cold; however, the impending cold snap will bring bone-chilling temperatures to a large area of the northern USA, including many major metropolitan areas. Life-threatening temperatures and wind-chill temperatures are being forecast in the Chicago area this week – see Figure 1 below.
According to the KDVR website, “ the forecast models the weather service is referring to have consistently shown numerous days dropping to at least minus-20 degrees or colder next week. For reference, Chicago has had only 15 days ever drop to minus-20 or colder in 150 years of record keeping. There is also the potential that Chicago will see multiple days that fail to reach 0 for the high-temperature — something that has happened only twice in the past 20 years, and 22 times in the past 100 years.”
Before I explain what the cause behind this very cold weather is, let’s look at the forecast minimum temperatures and the departures from normal on Wednesday 30th over the Northern Plains and Midwest and the Northeast on Thursday 31st January (See Figures 2 and 3 below).
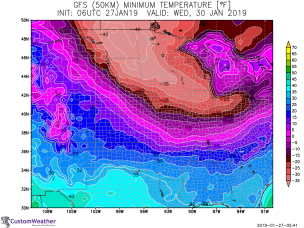
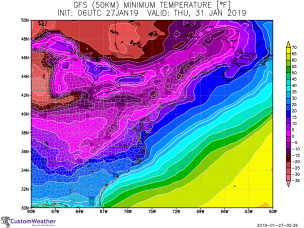
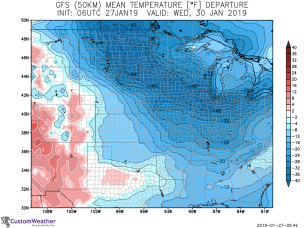
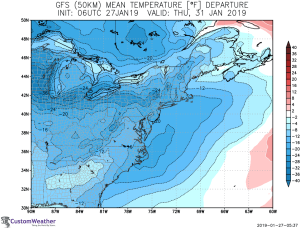
The forecast shows temperatures in the upper Midwest will be well below zero on Wednesday morning, and temperatures may not even get above -20°F by midday as far south as northern Indiana. Strong northwest winds will push this cold air into the Ohio Valley, and New England by Thursday where record-breaking low temperatures may occur. As can be seen in Figures 3 and 4 (above), bitterly cold morning low (minimum) temperatures are being forecast – with departures from normal temperatures around 40°F degrees below average. Here are some expected low and high temperatures this week (°F):
|
CITY |
MON |
TUE |
WED |
THU |
FRI |
|
International Falls |
-17/5 |
-28/-19 |
-38/14 |
-38/-5 |
-14/-12 |
|
Minneapolis |
2/10 |
-12/-11 |
-30/-16 |
-27/0 |
0/21 |
|
Chicago |
13/32 |
-2/4 |
-26/-15 |
-19/3 |
3/31 |
|
New York |
29/37 |
29/43 |
29/31 |
9/20 |
20/28 |
|
Philadelphia |
28/40 |
30/45 |
26/32 |
6/19 |
11/29 |
However, of greater concern than the actual temperatures being forecast are the wind chill temperatures – what it will really feel like – as see in Figure 4 below and no, those are NOT mistakes, that IS a MINUS 60°F in Minnesota.
So, what’s behind the expected cold weather? Short answer – the Polar Vortex will bring about a massive arctic cold air outbreak and here is an explanation of how it all works:
What exactly is the polar vortex? Essentially, it is the boundary between very cold polar air situated over the polar regions and warmer air to the south (in the Northern Hemisphere). It can also be seen as the nondairy between lower pressure in the upper levels of the atmosphere over the polar regions and higher pressure to the south (in the northern hemisphere). Figure 5 below shows a typical pattern of the Arctic Polar Vortex.
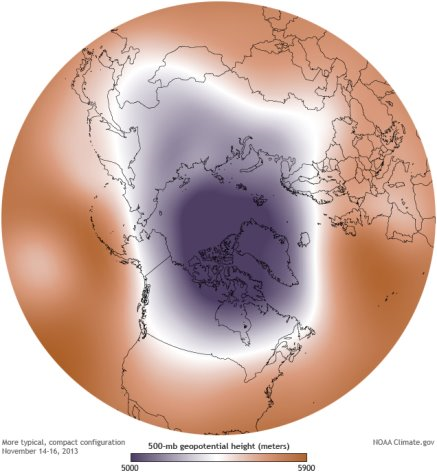
This whole area of low pressure rotates in a counter-clockwise manner at the North Pole. The boundary between the lower pressure (and colder air) over the North Pole and the higher pressure (warmer air) is where we find the Jetstream and is where the sharpest differences between the lower and higher pressure occur (and also between the warmer and colder air). The colder the air is over the North Pole and the warmer the air is to the south, then the stronger the Jetstream as it is directly proportional to the gradient (change over distance) of air pressure and temperature. Under normal conditions in winter, the Jetstream becomes stronger as the polar regions get colder and the difference in pressure and temperature across the boundary becomes greater. This more typical pattern of the polar vortex as shown in Figure 5 creates a stronger, more zonal Jetstream pattern, meaning the flow and tracks of the accompanying winter storms is more in an east-west orientation moving from the west towards the east and the west coast receives abundant rain and very cold outbreaks over the United States are generally rare as the very cold air remains north of the zonal Jetstream in Canada.
However, during some winters, the air over the Arctic is warmer than normal and/or the air to the south of the polar vortex (in the northern Hemisphere) is cooler than average. Air temperatures to the south of the polar vortex in the Northern hemisphere are greatly influence by phenomena like EL Niño/La Niña and the Pacific Decadal Oscillation (previously covered in this blog). During strong EL Niño years, the difference in pressure and air temperature across the boundary of the polar vortex is much greater than during normal winters and much weaker during La Niña years. Figure 6 below shows the typical “wavy” pattern of the polar vortex when pressure and temperature gradients are weak across the boundary and the Jetstream is weaker than normal.

During this type of pattern, the Jetstream becomes less zonal and more meridional, meaning, it meanders north and south instead of being in a more east-west alignment. Figure 7 below summarizes the differences between a strongly zonal pattern and a strongly meridional pattern.
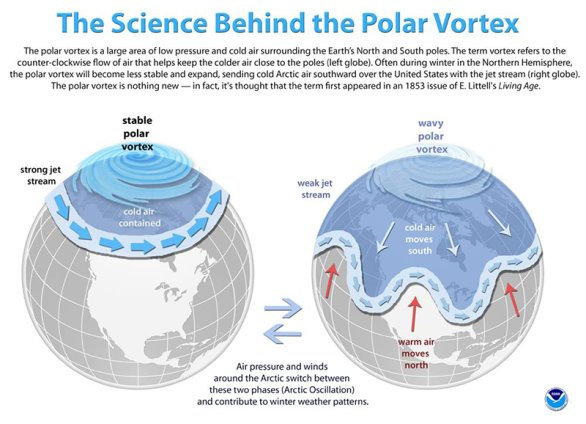
During a weak Jetstream/wavy polar vortex pattern (Figure 7, right) very cold air from the polar regions (called low pressure troughs) is able to penetrate far south into the United States in some places, while very warm air can surge far northwards (called high-pressure ridges) into Canada in other places. Often the location of the troughs and ridges and hence, the warmer/colder than normal remain in places for days to weeks on end in a pattern called a “blocking” pattern. December 2017 was a classic example of this “stuck” or “blocking” pattern over the United States where we had a strong high-pressure ridge (and warmer than normal temperatures and near zero rainfall) over the western half of the country and a low-pressure trough (colder than normal temperatures and above average precipitation) over the eastern half of the country. Figure 8 below shows this very well indeed.
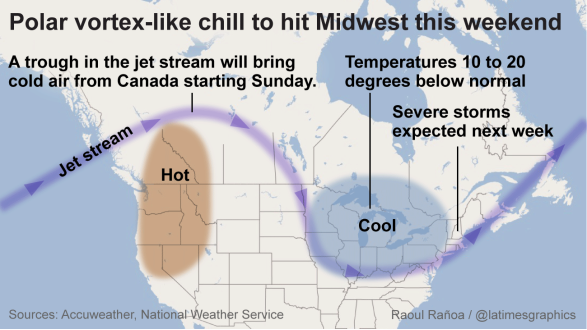
Figure 8: December 2017 stagnant polar vortex pattern. (courtesy: NWS)
Thankfully, this pattern will not get “stuck” and the very cold weather over the eastern half of the country will be short-lived. For those of you in the affected areas – stay warm!
Weekly Outlook:
Here is what to expect regarding precipitation and temperature in the coming week.
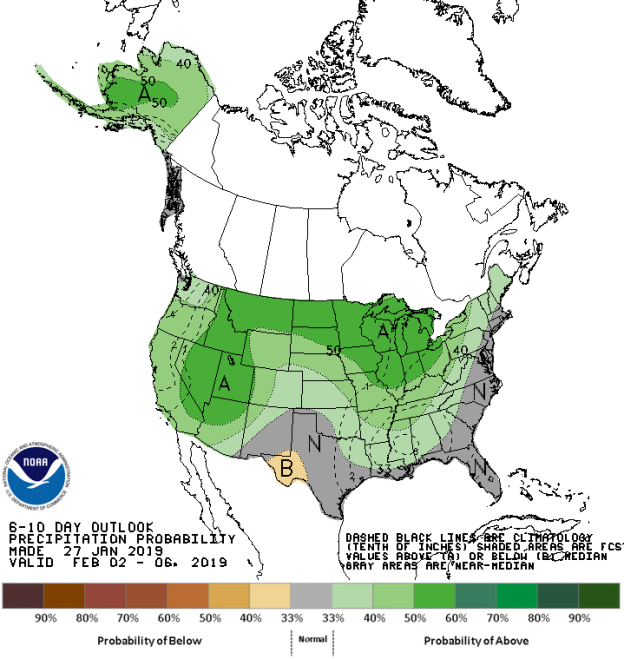
Figures 9 and 10 below show the expected 6-10-day temperature and precipitation outlooks. The colored shading on the map indicates the degree of confidence the forecaster has in the category indicated, where "B" and blue colors indicate "below-normal" and "A" and orange-red colors indicate "above normal". The darker the shading, the greater is the level of confidence. The numbers labeling the contours separating different shades gives the probability that the indicated category (A, B, or N) will occur.
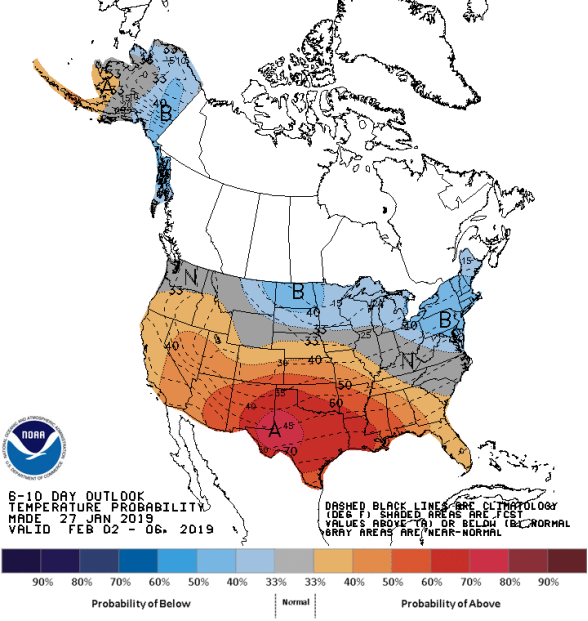
Generally, the probability of above average temperatures (as seen in Figure 9) is high over the entire southern half of the USA from Oregon in the West to Georgia and Florida in the east, centered on southwestern Texas, where the highest probabilities exist for above average temperatures. Confidence is low for below average temperatures over far eastern Alaska, the Northern Tier states from eastern Montana through the Midwest into New England. Washington, most of Montana, northern Idaho, Wyoming, Iowa and much of the southern Mid-Atlantic will experience mostly normal temperatures for this time of the year.
The precipitation outlook for the next 6-10 days (Figure 10) shows low confidence of below average precipitation over a small area of southwestern Texas. Almost the entire rest of the country should experience above average precipitation with a low to moderate confidence especially, over Neva and Utah and most of the Northern Tier states, the Midwest and much of the Ohio Valley. There is a moderate probability for above average rainfall over all of Alaska. Much of the East coast from Boston to Florida, the coastal areas of the Gulf Coast and much of Texas should experience mostly average precipitation for this time of the year.
Weekly hazards output by the NWS’s Climate prediction center for the next 3-7 days is shown in Figure 11 below.
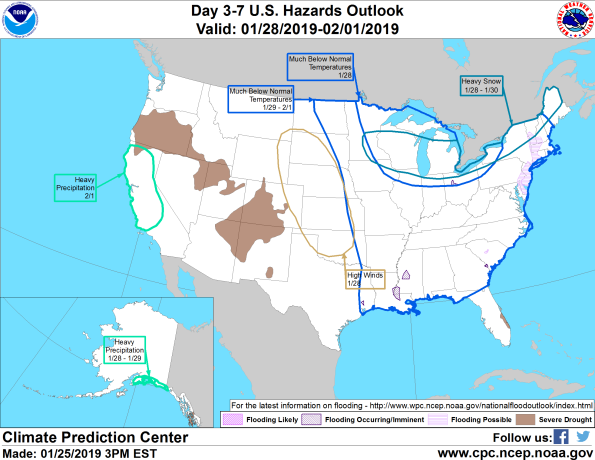
Figure 11 shows that most of the expected weather hazards over the United States in the next 3 to 7 days. The most important hazards will be the cold. Much below normal temperatures are expected over much of the eastern half of the USA between the 28th January and 1st February, especially over the Northern Tier states and the upper Midwest on the 30th and 31st January. Heavy precipitation is expected over much of California north of Los Angeles on the 1st February, and over the southeastern parts of Alaska between the 28th and 29th January. High winds are forecast on the 28th January over much of the Central and Northern Plains states, from Oklahoma to South Dakota.
Protect your brand AND revenue when disaster strikes.
Try ContactRelief FREE for 30 days. Discover how we can help you reach up to 5x more customers in a disaster zone – while protecting your brand image.
Start free trial