
Was 2018 a Climate Disaster?
ContactRelief Meteorologist Dr. Kevin Levey asseses the climate for all of 2018.
Monday, 11 February 2019 15:15:00 -06:00
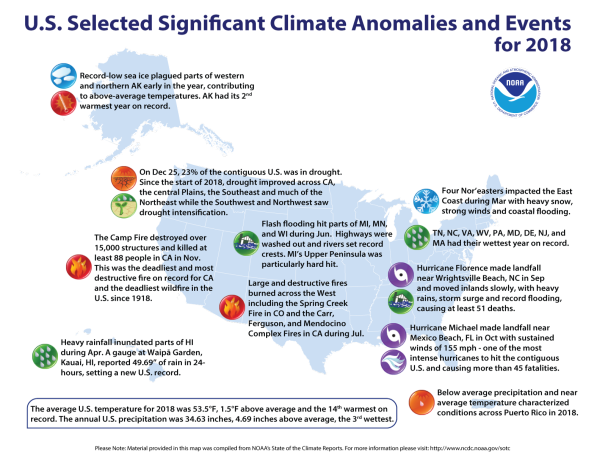
The contiguous United States had a warmer and wetter year on average in 2018. For 2018, the nationally averaged precipitation for the contiguous U.S. was 34.63”, based on preliminary analysis. This total was 4.69” above average, the wettest in the past 35 years, and third wettest since the modern record began in 1895. The total was largely driven by record and near-record annual precipitation across much of the eastern United States. The average annual temperature for the contiguous U.S. was 53.5°F, 1.5°F above the 20th-century average. This was the 14th warmest year on record and made 2018 the 22nd consecutive warmer-than-average year for the U.S. (1997 through 2018).
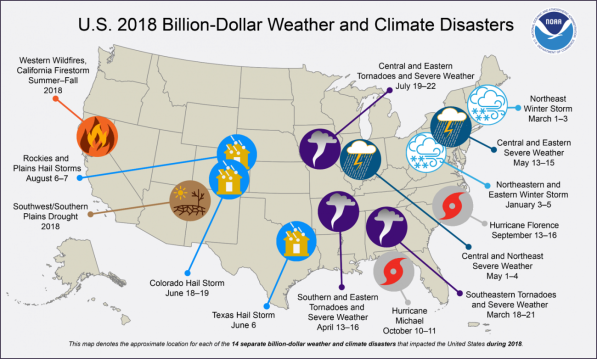
During the year, 14 weather and climate disasters each exceeded $1 billion in the United States (See Figure 1 below). There were 247 known fatalities associated with these events, and their total costs were estimated to be about $91 billion. Both the number of events and their cumulative cost ranked fourth highest since records began in 1980. Three events each exceeded $20 billion in damages: Hurricanes Florence and Michael caused $24 billion and $25 billion in damages in September and October, respectively, and a combination of western wildfires in summer and fall caused $24 billion in losses. This was the second consecutive year in which a new record was set for national losses due to western wildfires.
Annual Temperature
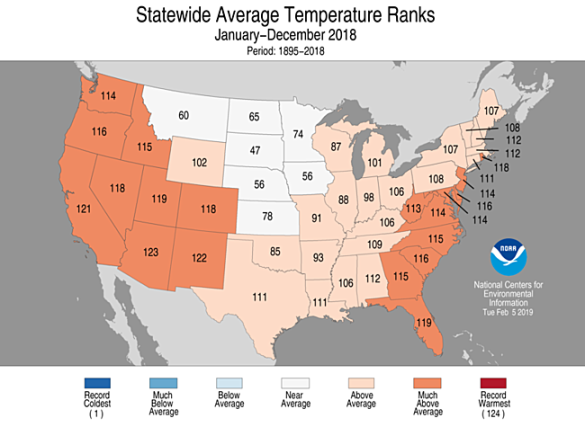
- Much of the contiguous U.S. was warmer than average, particularly west of the Rockies and across the coastal Southeast both of which were characterized by much-above-average temperatures - within their warmest 10 percent of the record. Most of the Northern Plains and Upper Midwest experienced near-normal temperatures.
- Fourteen states across the U.S. had annual temperatures among the 10 highest on record. Arizona: second highest; New Mexico: third highest; and California: fourth highest.
- South Dakota and Nebraska, respectively, observed annual average temperatures 0.4°F and 0.1°F below their 20th-century averages. Although these values are categorized as “near normal” or in the middle third of their respective histories, this marked the first year since 2014 that any state observed a temperature at least nominally cooler than its 20th century average.
- As has been the case for much of the 21st century, departures from average for daily minimum (overnight) temperatures were higher compared to departures from average for daily maximum (afternoon) temperatures. For the contiguous U.S., overnight temperatures were seventh highest on record, while afternoon temperatures were 26th highest. This effect was most noticeable in portions of the East, Midwest, and Plains where wetter conditions prevailed. North Carolina and Virginia observed the highest average overnight temperatures of their respective records.
- The last four-year (2015–2018) and five-year (2014–2018) periods are the warmest four- and five-year stretches on record for the contiguous U.S.
- Since 1895, the contiguous U.S. has observed an average temperature increase of 1.5°F per century.
-
Outside the contiguous U.S., Alaska’s statewide temperature of 30.4°F, which is 4.5°F warmer than its long-term (1925–2000) average, made 2018 its second warmest year on record, behind only 2016.
- The Alaska annual temperature is increasing at an average rate of 2.9°F per century since 1925.
Annual Precipitation and Drought
-
This was the sixth consecutive year with a nationally-averaged precipitation total greater than the 20th-century average.
- Since 1895, total annual precipitation across the contiguous U.S. has increased at an average rate of 1.81” per century.
-
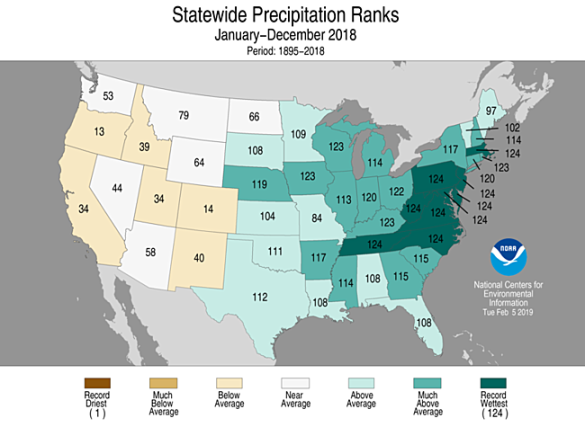
Much-above-average to record-high precipitation fell across much of the contiguous U.S. east of the Rockies. Nine eastern states – Delaware, Maryland, Massachusetts, New Jersey, North Carolina, Pennsylvania, Tennessee, Virginia, and West Virginia – experienced their wettest year on record.
- West Virginia’s statewide total of 65.13” broke its previous record (59.42” in 2003) by nearly six inches. North Carolina’s annual total of 68.36” was more than five inches greater than the previous state record (63.16” in 2003).
- Several locations in coastal North Carolina and the Southern Appalachians observed annual totals of 100” or more of precipitation for the first time in their observational history.
- Rainfall totals at several stations in eastern states appear to have set all-time single-station annual precipitation records for their states, according to preliminary data. These events will be investigated and confirmed in coming weeks.
- Much of the West and Pacific Northwest experienced a dry year. Oregon’s annual precipitation of 25.40” was nearly seven inches below average.
-
Drought was persistent across much of the American Southwest. A large area of extreme to exceptional drought dominated the Southern Plains early in the year, before improving during the summer, when drought intensified across Oregon and adjacent parts of the Pacific Northwest and Great Basin. Large parts of Colorado, New Mexico, Arizona, Utah and Oregon experienced drought throughout the vast majority of the year. Smaller parts of northern North Dakota, West Texas and Southern California did as well.
- According to the U.S. Drought Monitor, drought coverage peaked at 39.6% of the contiguous United States in early February 2018. This coverage was largely attributable to intense drought stretching from the Southern Plains across the southern Rockies and Four Corners regions. A secondary peak of 35.7% in early August was driven by continued drought in the Four Corners region and a new center of drought conditions in Oregon and parts of the adjacent Northwest.
- The winter 2017/18 season left abundant snowpack in the Northern Rockies and Northern Cascades. However, the Southern Rockies, Southern Cascades, and Great Basin ranges observed significantly below average snowpack by winter’s end, contributing to spring and summer drought conditions in adjacent regions.
Disasters and Other Notable Extremes
- During a 24-hour period spanning April 14-15, 2018, a rain gauge at Waipa Garden, near Hanalei, on the Hawaiian island of Kauai, observed 49.69” of rainfall. This is the greatest verified amount of precipitation observed in 24 hours in the United States. The previous record of 43” was set at Alvin, Texas, in July 1979.
-
There were 14 weather and climate disasters with losses each exceeding $1 billion during 2018. These disasters included: two tropical cyclones (Hurricanes Florence and Michael), one western wildfire disaster comprised of several constituent fire complexes over several months, eight instances of severe convective storms (hail, tornado, and/or damaging winds), one large drought episode, and two winter storms. The 14 events, in total, claimed at least 247 lives and had total losses estimated at $91 billion. About $73 billion of this total was attributable to three events: Hurricanes Michael ($25 billion) and Florence ($24 billion), and the complex of western wildfires ($24 billion)
- 2018 marked the eighth consecutive year with eight or more billion-dollar disasters, exceeding the long-term average of 6.2 per year. It was also the eighth year overall with at least 10 billion-dollar disasters; all but one of those years have occurred since 2008.
- In the 39-year record, the U.S. has sustained 241 weather and climate disasters where the overall damage costs reached or exceeded $1 billion each, adjusted to 2018 dollars. The cumulative losses costs for these 241 events exceed $1.6 trillion.
- Two large and devastating wildfires impacted California in early November. The Camp Fire burned more than 153,000 acres in Northern California, near Chico. The fire caused at least 88 fatalities and destroyed more than 18,000 structures, with the town of Paradise being the hardest hit. This marked the most destructive and deadliest wildfire on record in California, and the deadliest wildfire in the U.S. since the Cloquet Fire in 1918 killed 453 people in Minnesota. In Southern California, the Woolsey Fire destroyed more than 1,500 structures and caused at least three fatalities in and around Malibu.
- Hurricane Michael made landfall near Mexico Beach, Florida, on October 10th with sustained winds of 155 mph. This was the third most intense hurricane to make landfall in the contiguous U.S. based on central pressure and the fourth most intense based on wind speed. Michael was also the most intense hurricane on record to make landfall along the Florida Panhandle. The storm caused widespread devastation across the Florida Panhandle and farther inland across Georgia, the Carolinas, and Virginia. There were at least 45 fatalities blamed on the storm in the U.S.
- Hurricane Florence, one of the deadliest and costliest to ever impact the Carolinas, made landfall near Wrightsville Beach, NC, on September 14th and moved inland slowly, with heavy rains, storm surge and record flooding, causing at least 51 deaths and extensive flooding across much of the Carolinas and Virginia.
- The U.S. Climate Extremes Index (USCEI) for 2018, when taking into account landfalling tropical cyclones, was 66% above average and ranked as the eighth highest annual USCEI in the 109-year record. When excluding the tropical cyclone component, the USCEI remained 66% above average and ranked as the ninth highest on record. Extremes in warm minimum temperatures (fifth highest) and days with precipitation (highest) contributed to the elevated USCEI. The USCEI is an index that tracks extremes (falling in the upper or lower 10 percent of the record) in temperature, precipitation, drought and landfalling tropical cyclones across the contiguous U.S.
Weekly Outlook:
Here is what to expect regarding precipitation and temperature in the coming week.
Figures 5 and 6 below show the expected 6-10-day temperature and precipitation outlooks. The colored shading on the map indicates the degree of confidence the forecaster has in the category indicated, where "B" and blue colors indicate "below-normal" and "A" and orange-red colors indicate "above normal". The darker the shading, the greater is the level of confidence. The numbers labeling the contours separating different shades gives the probability that the indicated category (A, B, or N) will occur.
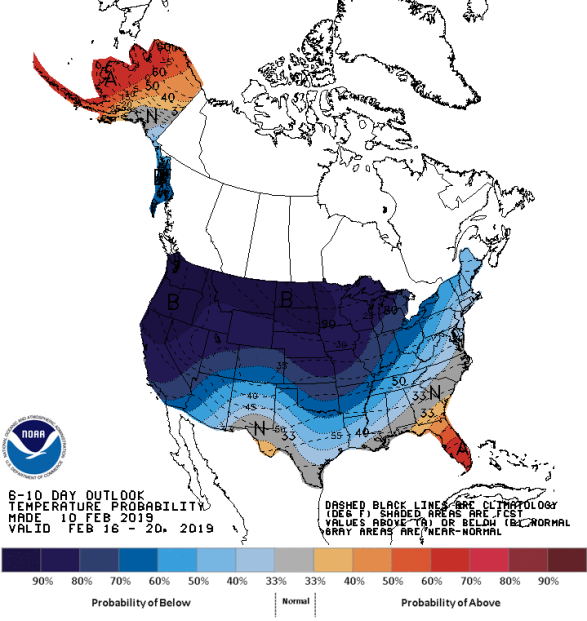
Generally, the probability of above average temperatures (as seen in Figure 5) is high over the southern areas of Florida and also over almost all of Alaska, expect the far southeastern areas. Confidence is very high for below average temperatures over much of the rest of the USA, especially over the western and Northern Tier states. The far southern areas of Texas, southern Alabama, central Georgia and the coastal areas of the Carolinas will experience mostly normal temperatures for this time of the year.
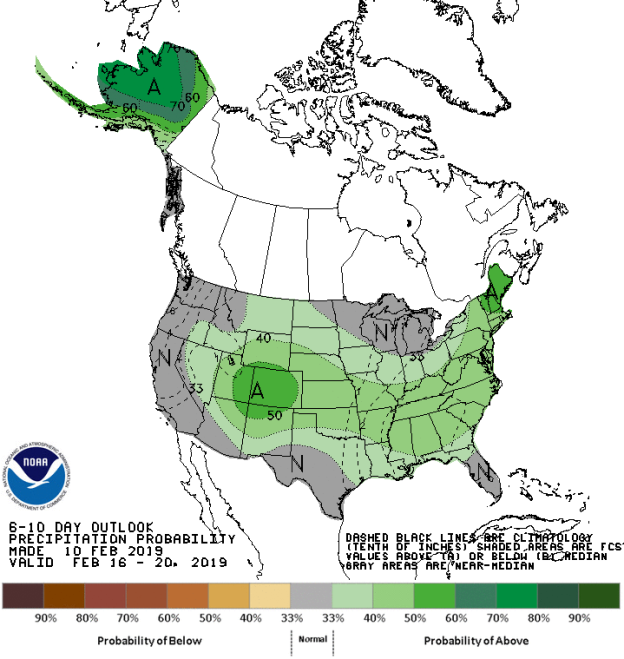
The precipitation outlook for the next 6-10 days (Figure 6) shows no areas where below average precipitation is expected. Most of the country has a low to moderate probability of above average rainfall, with highest possibilities over Colorado and the far northern areas of New England and all over Alaska. The entire West Coast, southern Texas and the Midwest will experience average precipitation for this time of the year.
Weekly hazards output by the NWS’s Climate prediction center for the next 3-7 days is shown in Figure 7 below.
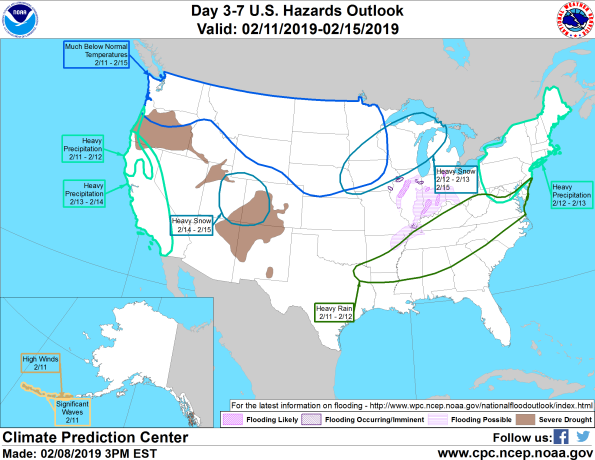
Figure 7 shows that most of the expected weather hazards over the United States in the next 3 to 7 days. Much below normal temperatures will occur over the eastern Pacific Northwest, the Northern Tier states and the Northern Plains states from Washington to Minnesota and as far south as Nebraska between the 11th and 15th February. Heavy precipitation is expected between the 11th and 23th February over much far northern areas of California and the southern coastal areas of Oregon. Heavy precipitation is also expected over the entire state of California between the 13th and 14th with possible flooding over Southern California. Heavy precipitation is also expected over much of New England between the 12th and 13th February. Heavy rain is possible over a large area stretching from far northeastern Texas through the Tennessee Valley into the Mid-Atlantic states between the 11th and 12th February. Heavy snow is forecast on the 14th and 15th February over much of the eastern areas of Utah and western areas of Colorado Rockies. Significant waves and high winds are expected on the 11th February over the western Aleutian Island chain of Alaska.