
California Floods and the Deep South Devasted by Tornadoes
Atmospheric Rivers, Tornadoes, and What's Up Next Week
Monday, 04 March 2019 10:15:00 -06:00
Severe weather struck California last week and areas in the Deep South over the weekend. Let's dive in and examine these events in detail as it may help us later as winter fades and similar spring storms are upon us.
Northern California Flooding
A potent Atmospheric River caused massive flooding last week in the Northern California county of Sonoma around the Russian River prompting the governor of California to declare a countywide emergency. Atmospheric Rivers (AR’s) are relatively long, narrow regions in the atmosphere that transport most of the water vapor outside of the tropics. These columns of water vapor are shaped by circulation patterns, carrying massive amounts of water vapor roughly equivalent to the average flow of water at the mouth of the Mississippi River, while very strong AR’s can contain up to 7.5 to 15 times the amount of water than the average flow at the mouth of the Mississippi River. When the AR makes landfall, it often releases this water vapor in the form of rain or snow lasting from at least 12 hours to up to 36 hours – some have even lasted up to 100 hours!
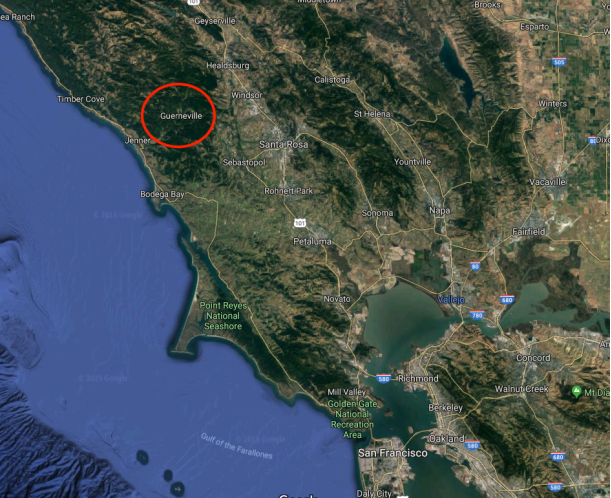
Located on the Russian River in Sonoma County about an hour north of San Francisco, Guerneville is no stranger to major flooding. Guerneville is highlighted in red shown below in Figure 1.
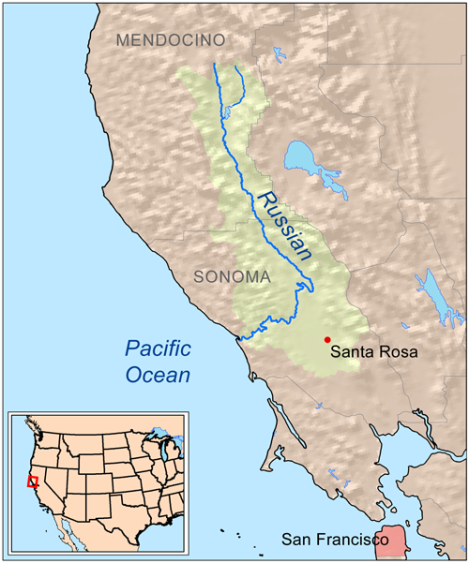
The Russian River drainage basin is particularly large and is shown in Figure 2 below. Its source is up in far northern California and enters the sea at Jenner in Sonoma County. It covers an area roughly 1485 square miles, and the Russian River is approximately 110miles long.
The Russian River has flooded in Guerneville on a number of occasions in the past (flood stage is 32 feet):
- 48.8’ – 02/18/1986
- 48.0’ – 01/10/1995
- 47.6’ – 12/23/1955
- 47.4’ – 12/23/1964
- 46.9’ – 02/28/1940
- 45.4’ – 02/27/2019
- 45.0’ – 01/01/1997
- 42.5’ – 01/05/1966
- 41.8’ – 01/01/2006
- 41.5’ – 03/10/1995
- 41.3’ – 01/24/1970
- 41.1’ – 02/01/1963
- 40.7’ – 01/17/1974
- 40.4’ – 01/27/1983
- 40.2’ – 02/25/1958
Anything above 40 feet causes major damage along the river, including Guerneville and surrounding towns. As you can see the flooding last week ranks as the 6th worst in the town’s history. I followed the lead-up to the event very carefully, and at first, the main American forecast model, the GFS and the European forecast model (ECWMF) were not in sync like that had been for the previous AR only two weeks earlier that struck the same region. The Russian River then only reach a maximum of 32 feet, and the town was spared from major flooding. Even though the GFS stood firm in its forecast some 2-3 days before the event, the NWS was slow to issue potential flood watches and warnings since the European forecast model was not in agreement, but over the course of the weekend, both models converged on pretty much similar forecasts (although the GFS did have much higher amounts over a much larger area, including the San Francisco Bay region). However, by last week Monday, 25th Feb, flood warnings were issued as the focus of the atmospheric river became clearer and clearer – focused on areas north of the Golden Gate Bridge northwards including a very large area of the Russian River Drainage basin prompting the California Nevada River Forecast Center to issue a forecasted flood crest in Guerneville of 45.6FEET (almost 14 feet above flood stage) sometime late on WED evening.
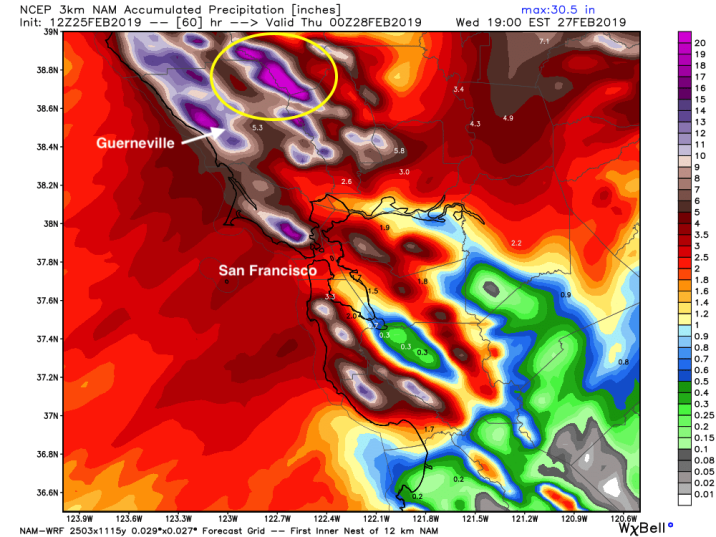
On Monday the 25th around noon, the short-term North American Model (NAM) showed some eye-popping potential accumulated 60-hr precipitation totals ending 4 pm Wed evening. Figure 3 below shows the 60-hour precipitation forecast, and I highlighted the very high forecasted totals of >20” in the yellow circle which is in the Russian River Drainage Basin.
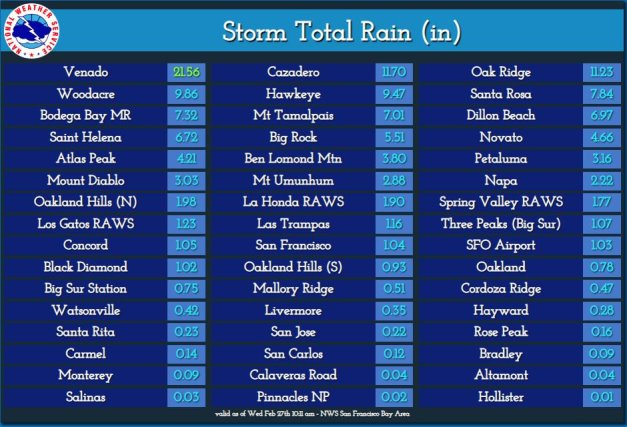
The rains started early Monday morning over most of Sonoma and persisted non-stop for over 36 hours. Venado, which is about 9 miles northwest of Guerneville received 21.56” of rainfall in about 36 hours. Other totals of over a FOOT of rain were measured in Guerneville itself. Figure 4 below shows the remarkable rainfall (36-hour totals), but what is most remarkable is the marked boundary of the atmospheric river over the San Francisco Bay area where the airport only measured 1.03&rdquo, and further south barely any rain occurred. Once again highlighting just how narrow and focused these atmospheric rivers can be. Santa Rosa, about 15 miles east from Guerneville recorded their wettest calendar day on record on the 27th with 5.66”.
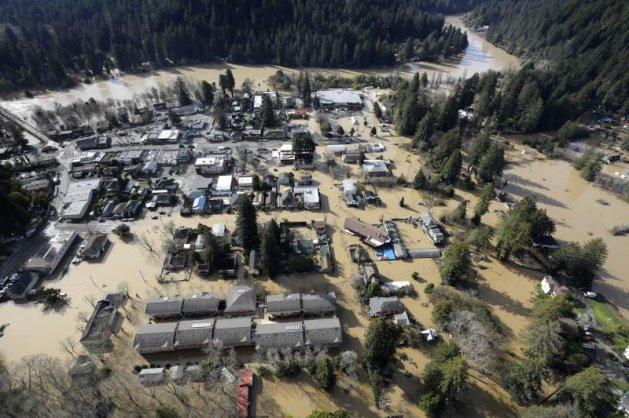
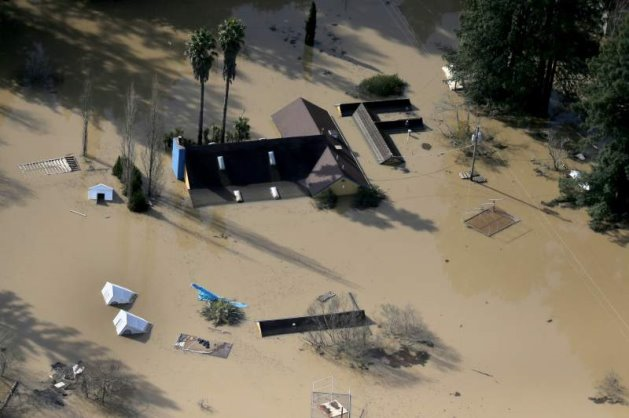
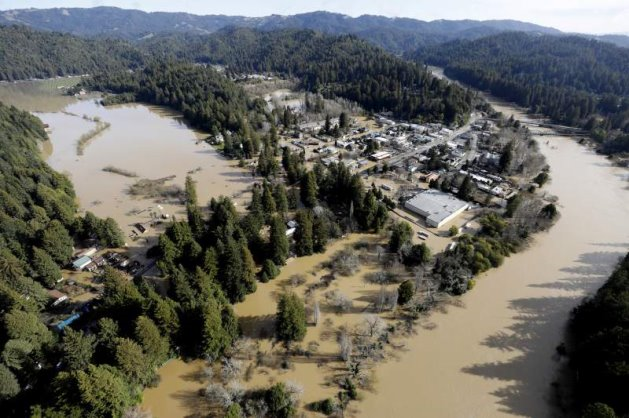
Historically, 90% of major floods along the Russian River can be attributed to Atmospheric rivers. Figure 5 below shows Guerneville underwater on Thursday 28th Feb.
Studies have shown that atmospheric rivers affecting California may become more frequent and stronger under a warming climate and if that holds true, then, unfortunately, the flooding along the Russian River will also become more frequent.
Severe Tornado Outbreak in the South
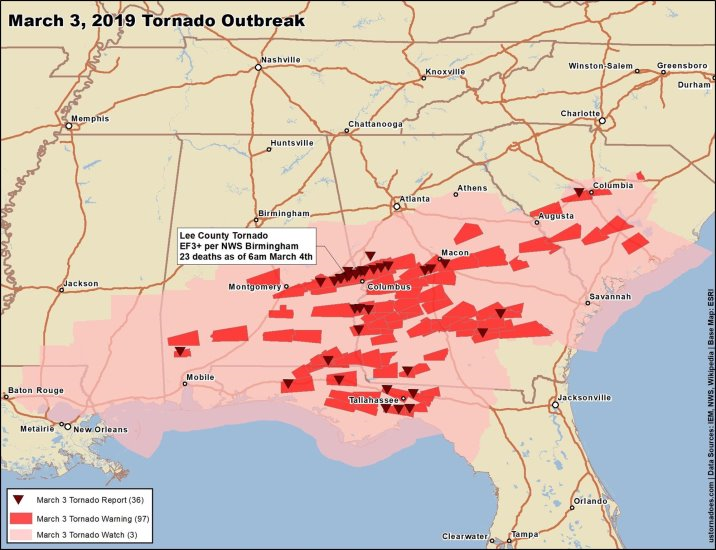
Unfortunately, one of the worst tornado outbreaks since 2013 occurred over the Deep South late yesterday. As of Monday morning, 23 confirmed fatalities in Lee Country in Alabama, where preliminary findings show that an EF3 tornado touched down there. In all of 2018, only ten people lost their lives to tornadoes. Figure 8 below shows the widespread outbreak and confirmed tornado reports.
Weekly Outlook:
Here is what to expect regarding precipitation and temperature in the coming week.
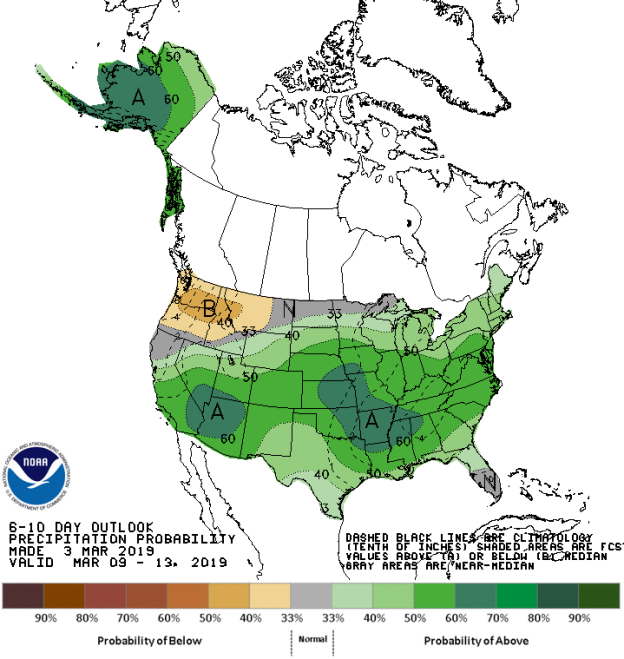
Figures 9 and 10 below show the expected 6-10-day temperature and precipitation outlooks. The colored shading on the map indicates the degree of confidence the forecaster has in the category indicated, where "B" and blue colors indicate "below-normal" and "A" and orange-red colors indicate "above normal". The darker the shading, the greater is the level of confidence. The numbers labeling the contours separating different shades gives the probability that the indicated category (A, B, or N) will occur.
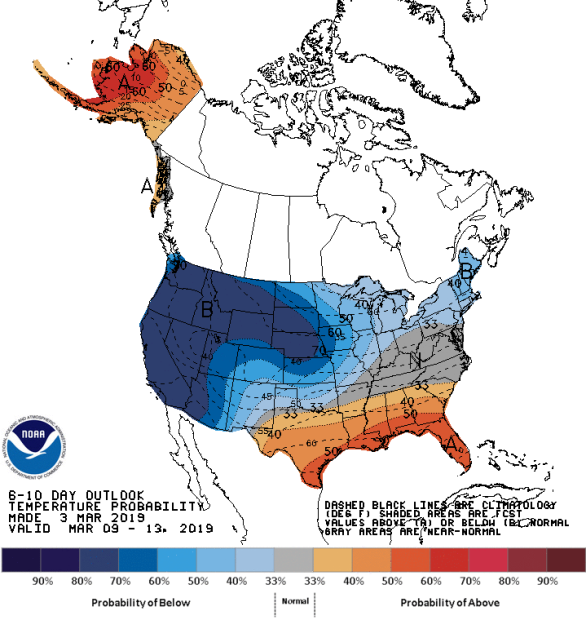
Generally, the probability of above average temperatures (as seen in Figure 9) is moderate over Florida and the Gulf Coast States, including the southern half of Texas and also high over most of Alaska. Confidence is high for below average temperatures over much of the rest of the USA, especially western third of the USA and the over the Northern Tier states and the Northern Plains States, while chances are slightly lower for below average temperatures further east into the Midwest and New England areas. Few areas including the Tennessee River Valley and much of the Mid-Atlantic Carolina will experience normal temperatures for this time of the year.
The precipitation outlook for the next 6-10 days (Figure 10) shows a low to moderate probability of below average precipitation over the Pacific Northwest, including most of Montana. Most of the rest of the country has a moderate probability of above average rainfall, while the chances of above average rainfall are much higher over parts of Arizona, the Central Plains States and parts of Arkansas and northern and most of Alaska. Generally, far northern California and the far northern areas of the Northern Tier States will experience average precipitation for this time of the year.
Weekly hazards output by the NWS’s Climate prediction center for the next 3-7 days is shown in Figure 11 below.
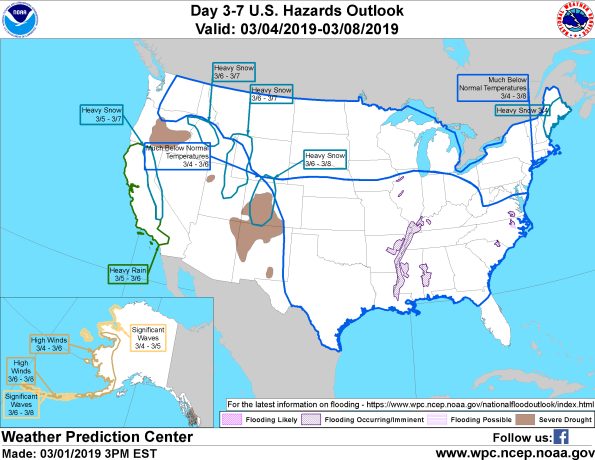
Figure 11 shows that most of the expected weather hazards over the United States in the next 3 to 7 days. Much below normal temperatures will continue much of the Northern Tier states from eastern Washington into the New England and as far south as Iowa between the 4th and 8th March, while much below normal temperatures should be expected over the entire eastern half of the country from Colorado to Virginia in the North southwards to the Gulf Coast, excluding central southern Florida between the 4th and 6th March. Heavy precipitation associated with another atmospheric river is expected between the 5th and 7th March over almost all of California (while the atmospheric river will be focused on southern Central California. Heavy snow is expected over parts of southern Idaho and far western Wyoming between the 6th and 7th March and between 6th and 8th March over the Colorado Rockies. Heavy snow is also possible on the 4th March over much of coastal Maine. Significant waves and high winds are expected between the 6th and 8th March over the Aleutian Islands of Alaska and between the 4th and 6th over much of Western Alaska. Continued flooding along the Mississippi River from Kentucky southwards should still be expected.