
Spring Flooding Outlook
Many midwest states have already flooded. Will there be more?
Wednesday, 27 March 2019 11:40:00 -05:00
NOAA released their flood and climate outlook for the USA for spring 2019 this past week. According to the outlook, a wet winter has set up much of the Great Plains for spring flooding in 2019 (see Figure 1 below), with major flooding likely along the Red River over the Dakotas, and the Missouri and Mississippi Rivers. Moderate flood risk extends upstream of those rivers to their tributaries, including the lower Ohio, the Cumberland, and Tennessee Rivers. Minor flood risk covers nearly the entire country east of the Mississippi as well as parts of Washington, Oregon, and California.
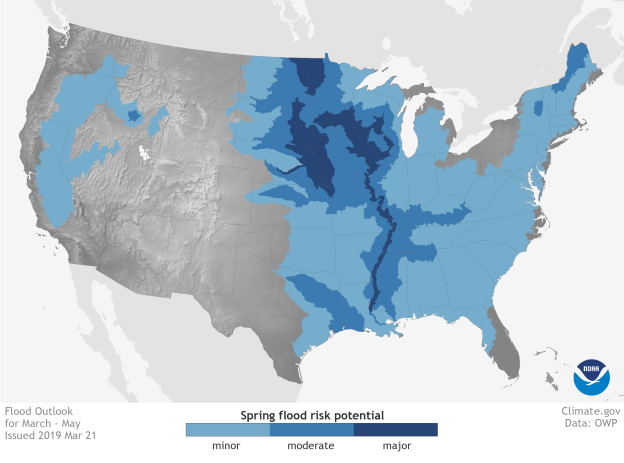
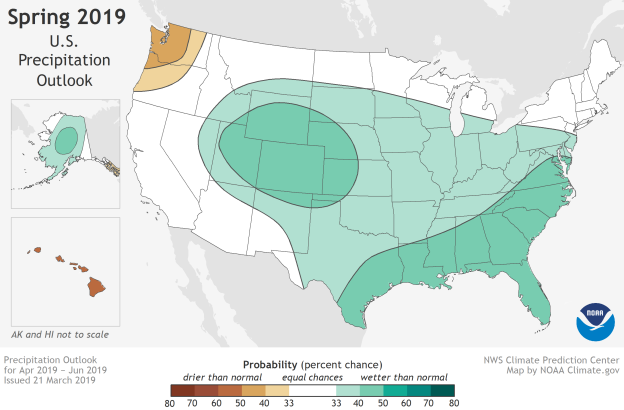
Figure 2 below shows that the wet winter isn't the only contributor to the expansive flood risk. Across much of the country, the risk of well above average precipitation is elevated. (In any given year, the baseline probability for unusually wet, unusually dry, or near-average seasonal conditions is 33 percent each). For example, a swath of states along the southeastern seaboard and the Gulf Coast have a 40-50 percent chance of seasonal precipitation in the upper third of the climatological record. (That's compared to a 33 percent chance of near-average precipitation and a 17-27 percent chance of precipitation in the lower third of the climatological record.)
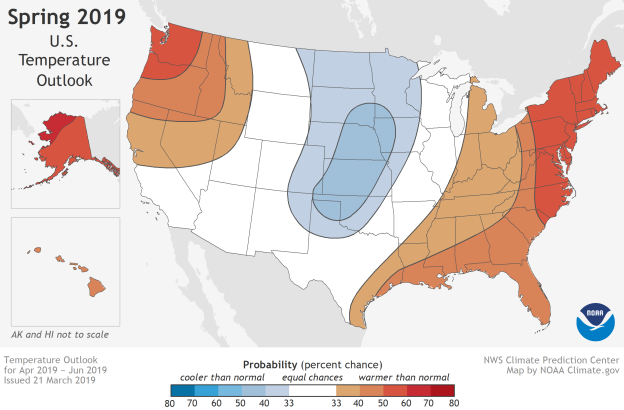
What about expected temperatures? Figure 3 below shows below-average temperatures are most likely in the Central and Southern Plains, where the saturated ground will slow down the seasonal warm up. Odds for a much warmer than average spring are elevated above background probability levels in Alaska (where lack of sea ice in surrounding waters allows more rapid seasonal warming), in areas east of the Mississippi, and in the West and Pacific Northwest.
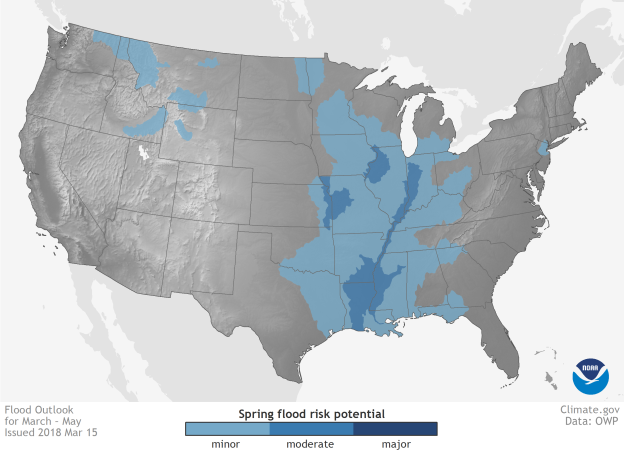
For comparison, Figure 4 below shows the spring 2018 flood risk over the USA showing that this year’s flood potential is much greater, unfortunately.
Weekly Outlook:
Here is what to expect regarding precipitation and temperature in the coming week.
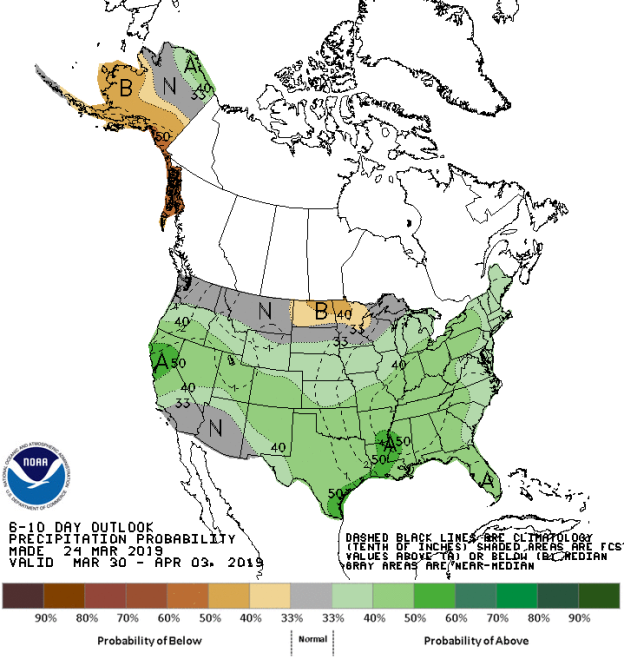
Figures 5 and 6 below show the expected 6-10-day temperature and precipitation outlooks. The colored shading on the map indicates the degree of confidence the forecaster has in the category indicated, where "B" and blue colors indicate "below-normal" and "A" and orange-red colors indicate "above normal". The darker the shading, the greater is the level of confidence. The numbers labeling the contours separating different shades gives the probability that the indicated category (A, B, or N) will occur.
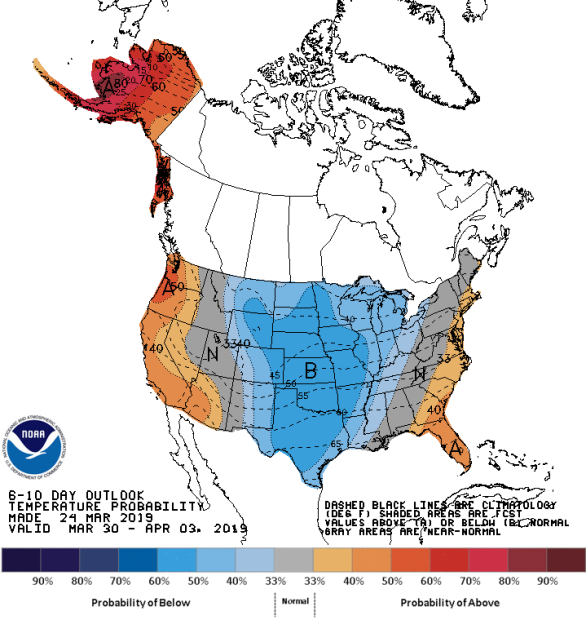
Generally, the probability of below average temperatures (as seen in Figure 5) is moderate over most of the central areas of the USA, stretching from Texas northwards into the Upper Plains and the Midwest. Confidence is high for above average temperatures over Alaska. Confidence is low to moderate for above average temperatures over the West Coast, including western Arizona and western Nevada and much of the East Coast form Florida northwards to Boston. The remainder of the areas between the above or below normal temperatures should experience normal temperatures for this time of the year.
The precipitation outlook for the next 6-10 days (Figure 6) shows a low probability of below average precipitation over a small area including North Dakota and northern Minnesota. In general, the rest of the country has a low to moderate probability of above average rainfall, with the highest probabilities over central California and the southern Mississippi River Valley. Washington, Montana, northern South Dakota, southern Minnesota, northern Wisconsin, southern California, and southern Arizona will experience average precipitation for this time of the year.
Weekly hazards output by the NWS’s Climate prediction center for the next 3-7 days is shown in Figure 7 below.
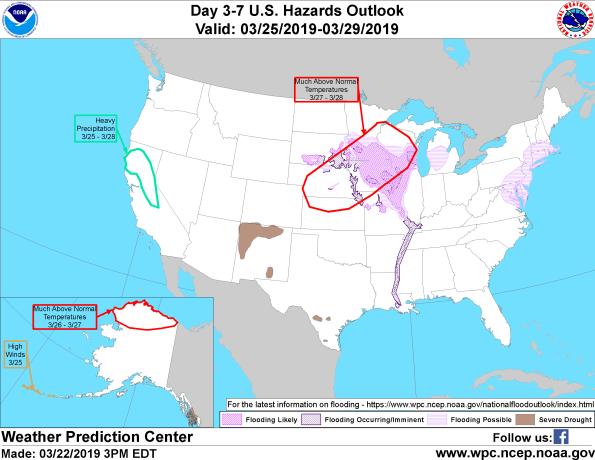
Figure 7 shows that most of the expected weather hazards over the United States in the next 3 to 7 days. High winds are expected over the far western Aleutian Islands of Alaska on the 25th March. Heavy precipitation is possible over Northern California and the Northern between the 25th and 28th March. Much above normal temperatures are expected over northern Alaska between the 27th and 28th March and over much of the Northern Plains states and the Midwest from Nebraska to Wisconsin between the 27th and 28th March. Flooding is possible over a large area over the upper Plains States and Midwest including Iowa, much of southern Wisconsin and Minnesota, central Michigan and northern Illinois. Flooding is also possible over much of far northeastern Virginia, Maryland, stretching northwards into western Pennsylvania, New Jersey and the southern areas of New England. Flooding is currently occurring over much of the central and southern Mississippi River from Kentucky southwards into Louisiana.
Get in touch
Shaping your outbound contact away from disaster stricken areas isn't just the right thing to do, it's smart business. To learn more about how ContactRelief can help you protect your brand, reduce your risk of adverse actions, and improve your contact center efficiency, click below to contact us.
Contact us