Warming stripes – a picture is worth a thousand words!
ContactRelief meteorologist Dr. Kevin Levey looks at climate change with a new visualization tool.
Monday, 24 June 2019 16:55:00 -05:00
First a quick tropical weather update!
The Gulf of Mexico and Atlantic Ocean remain quiet with no tropical activity expected in the next 48-hours as shown in Figure 1 below.
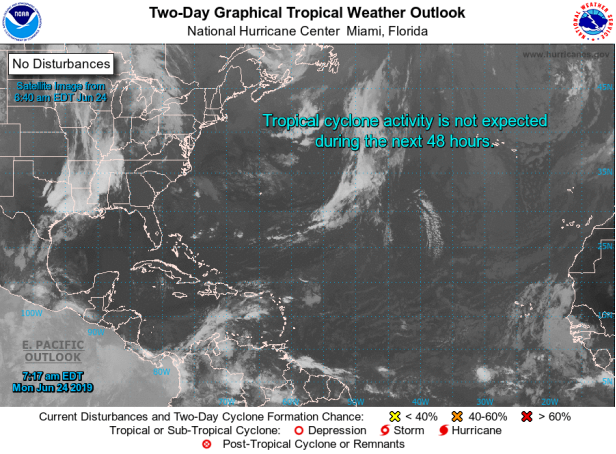
Figure 1: Current tropical activity in the Atlantic Ocean (Courtesy: National Hurricane Center).
Warming stripes – a picture is worth a thousand words!
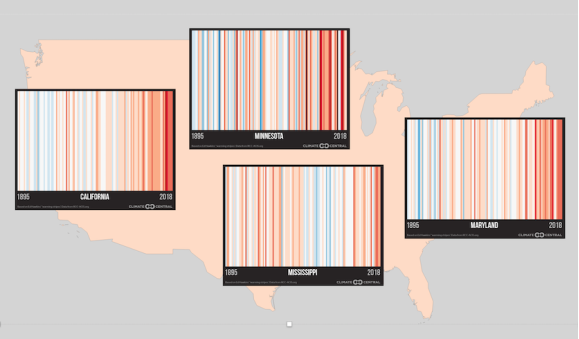
Figure 2: Warming stripes for four U.S. states—California, Minnesota, Mississippi, and Maryland—show the differing patterns of a century of warming, as detailed below (Courtesy: NOAA/NCEI).
The summer solstice arrived last Friday, June 21, and so did the second year of “warming stripes”. Depending on your local TV meteorologist, you may or may not have seen nor heard about them. Launched in 2018, this growing campaign builds on a set of imagery developed by University of Reading climate scientist Ed Hawkins. They are colored stripes that portray a century-plus of global warming at a single glance. Remember, a picture is worth a thousand words.
This year’s campaign is taking the global trend and drilling down to individual U.S. states and cities. Climate Central has unveiled a website that allows you to generate warming stripes for 160 U.S. cities and all 50 U.S. states. The campaign has also revved up its use of social media, and dozens of broadcast meteorologists around the world used warming stripes on air and online last Friday, bringing home the reality of our warming planet.
“Meteorologists have a unique opportunity as trusted local messengers to educate audiences and help to create transformative change in a very challenging time,” said Jeff Berardelli, who coordinated last year’s effort among weathercasters, Meteorologists United on Climate Change (#MetsUnite on Twitter). After many years as a full-time broadcast meteorologist, Berardelli has shifted gears in the past year, moving to New York to produce climate-oriented segments for CBS News while working on a master's degree focusing on climate and society at Columbia University’s Earth Institute.
“This year there will be a lot more participation as the masses join #MetsUnite to #ShowYourStripes!” said Berardelli. “Through a combined effort from Climate Central and Ed Hawkins, we have made this campaign accessible to everyone who cares about planet Earth.”
“Increasingly, the public is convinced that the climate is changing. However, they don't always know exactly what that means for them, their family, and their community,” said Bernadette Woods Placky, who directs the Climate Matters program at Climate Central. “TV meteorologists are in a unique position to help answer those questions. They help to connect the dots between climate change and the increase in heavy rain, more coastal flooding, challenges to our food and water systems, longer and stronger pollen seasons, and intensifying heat that takes a toll on the health of outdoor workers and results in rearranging of our kids' camp and sports schedules.”
USA: North, East, South, West - Four states, four snapshots
Figure 2 (above) shows that warming across the contiguous U.S. — approximately 1.9°F from 1895 to 2018, which is fairly close to the global trend. This has not played out in the same way everywhere. The common threads are a mostly natural warming in the early 20th century, a mid-century leveling (and cooling in some areas) driven in part by postwar industry and sun-blocking pollution, and a more sustained warming in recent decades as the influence of human-produced greenhouse gases becomes ever more prominent.
All graphs below are from the NOAA National Centers for Environmental Information (NCEI), with temperatures in degrees F (left) and degrees C (right). Century-scale warming rates are graphed; 30-year warming rates are given at the end of each US state discussion.
California saw fairly steady warming through the 20th century, but what jumps out the most is a dramatic spike during the severe drought of the early 2010s. Research has shown that California’s droughts are now far more likely to be hot, higher-impact droughts more likely to spawn wildfires. Even during the relative mildness since 2015, California has remained consistently hotter than in any year prior to 2010 (see Figure 3 below).
Amount of warming per decade in the last 30 years (1988-2018): 0.6°F
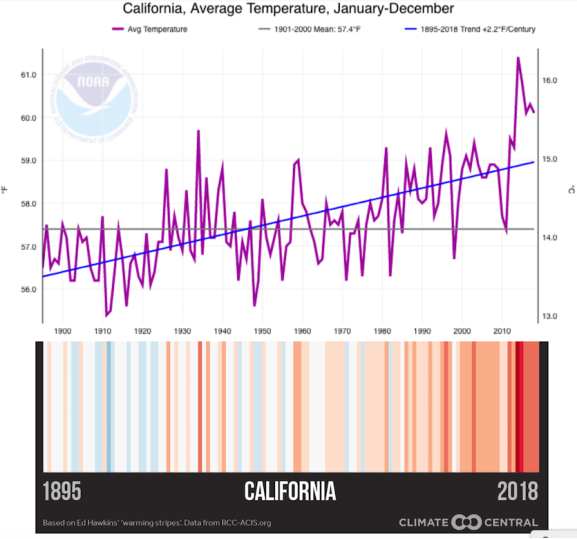
Figure 3: Warming stripes for California show the differing patterns of a century of warming, as detailed above (Courtesy: NOAA/NCEI).
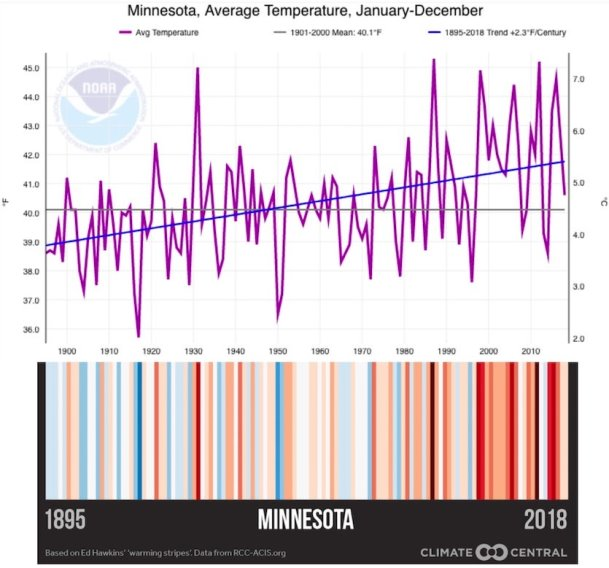
Much of the warming in Minnesota to date has taken place in the early and late 20th century, with fairly level temps in the mid-20th century, and little overall change in the last 20 years. It has been a rocky couple of decades, though, with plenty of year-to-year swings between exceptional warmth and more historically moderate readings. Such swings can play havoc with activities that range from winter festivals to summer planting. Polar-vortex intrusions that could be linked to Arctic sea ice loss led to sharply cold periods in the winters of 2013-14 and again in 2018-19 (see Figure 4 below).
Amount of warming per decade in the last 30 years (1988-2018): 0.5°F
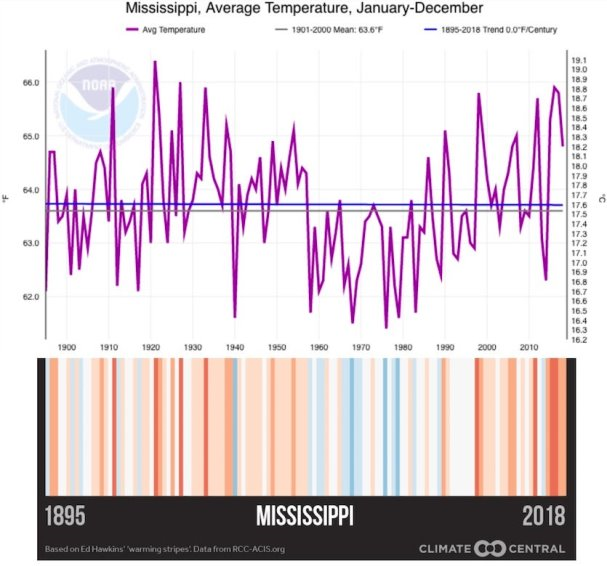
Mississippi has one of the nation’s more intriguing warming patterns. A midcentury cool down was so sharp in this part of the country that it led to what researchers dubbed the “warming hole” (no, not a “worm hole” – that is a whole different topic and blog), a complex feature with possible links to post–World War II industry and uncontrolled pollution as well as multi-decadal oceanic cycles. Whatever's caused it, the Southeast warming hole seems to be on the wane. Mississippi has warmed roughly 1.5°F in the past 30 years, and 2016 was one of the state’s hottest years on record (see Figure 5 below).
Amount of warming per decade in the last 30 years (1988-2018): 0.5°F
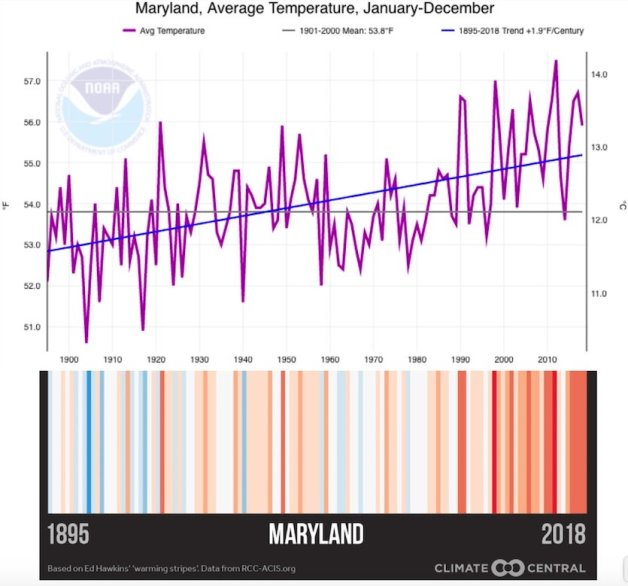
Of the four states profiled here, Maryland has the most gradual and most typical warming story. The midcentury cool spell and the sustained temperature rise since 1980 are both evident. Warming like this is easier to plan for, but the state has its hands full between aging infrastructure, sea level rise, and intensified precipitation. The Northeast, including Maryland, is seeing thenation’s biggest increase in heavy precipitation events, a process linked to human-produced climate change in many studies (see Figure 6 below)
Amount of warming in the past half century (1968-2018): 0.5°F
Weekly Outlook:
Here is what to expect regarding precipitation and temperature in the coming week.
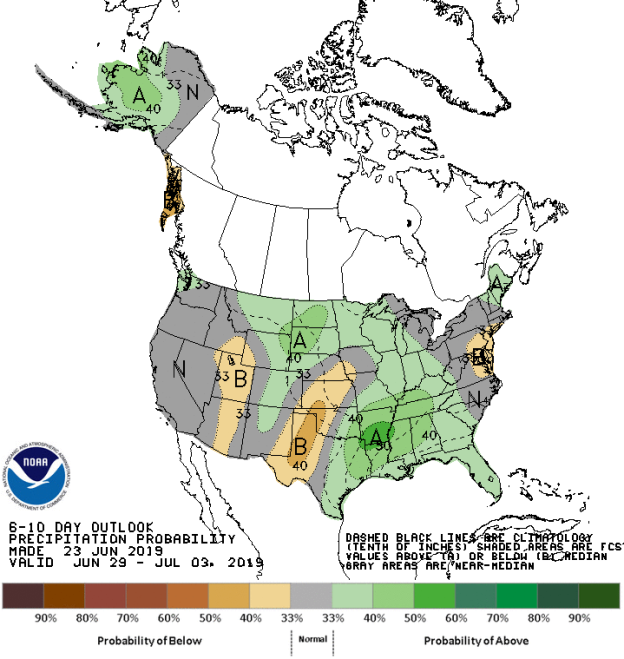
Figures 7 and 8 below show the expected 6-10-day temperature and precipitation outlooks. The colored shading on the map indicates the degree of confidence the forecaster has in the category indicated, where "B" and blue colors indicate "below-normal" and "A" and orange-red colors indicate "above normal". The darker the shading, the greater is the level of confidence. The numbers labeling the contours separating different shades gives the probability that the indicated category (A, B, or N) will occur.
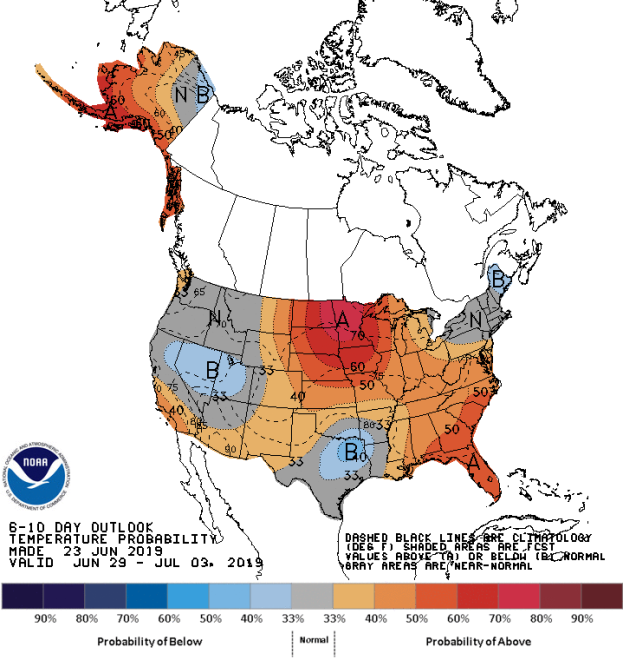
Generally, the probability of below average temperatures (as seen in Figure 7) is low over much of Nevada, Utah, northeastern Texas and much of New England. In general, the probability is moderate to high that Alaska, the Midwest and much of the eastern third of the country from the Mid-Atlantic southwards will experience above average temperatures. Other than the low chance of below average temperates discussed before, the remaining areas of the USA will experience normal temperature for this time of the year.
The precipitation outlook for the next 6-10 days (Figure 8) shows the probabilities are low for below average rainfall over the most of Nevada, central Arizona, northern areas of the Mid-Atlantic states and An area stretching from southwestern Texas northeastward into southwestern Iowa. The highest probabilities for above average rainfall exist over much of Arkansas, with lower probabilities of above average rainfall over the northwestern areas of the Pacific Northwest, far northern New England, much of eastern Texas, the Deep South, stretching north into the western areas of the Midwest and Northern Tier States. Most of the western third of the USA and much of the Mid-Atlantic and northeast should experience average rainfall for this time of the year.
Weekly hazards output by the NWS’s Climate prediction center for the next 3-7 days is shown in Figure 9 below.
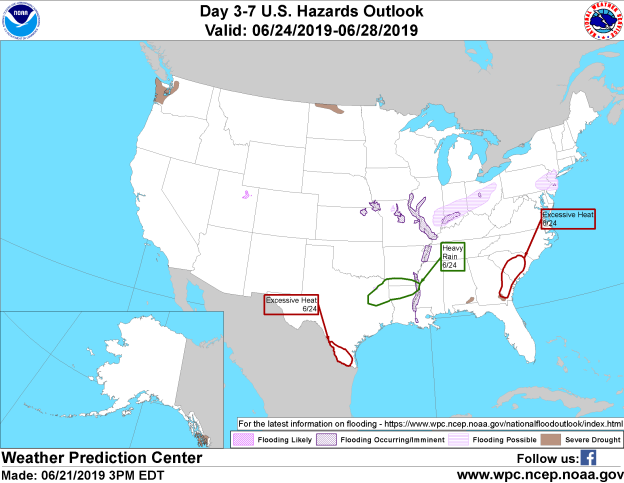
Figure 9 shows that most of the expected weather hazards over the United States in the next 3 to 7 days.
Heavy rain is expected over:
- Northeastern Texas, southern Arkansas and northern Louisiana on 24th June;
Excessive Heat:
- Far southwestern Texas on the 24th June;
- Southeastern Georgia and eastern South Carolina on the 24th June.
Flooding occurring or imminent:
- The Missouri River region south to Kentucky;
- The Mississippi River from Arkansas south to Louisiana;
- Parts of southeastern Texas;
Flooding possible:
- Large areas of southeastern Illinois;
- Southern Indiana;
- Large area of central Ohio;
- Far eastern Pennsylvania;
- New Jersey.
Flooding likely:
- Salt Lake City region.
Want to know precisely who NOT to contact during a disaster?
Find out with a free trial