Fourth of July - Will it rain on your parade?
ContactRelief meteorologist Dr. Kevin Levey looks to the climate record for rain on the 4th of July.
Tuesday, 02 July 2019 06:48:00 -05:00
But First - A Tropical Weather Update
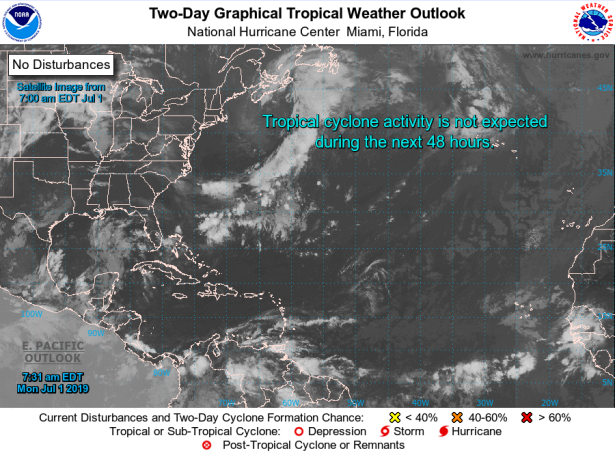
As is typical for the earliest few weeks of the hurricane season, all is quiet along the Gulf Coast this morning as well as throughout the Atlantic Ocean with no tropical cyclone development expected in the next two days (see Figure 1 below).
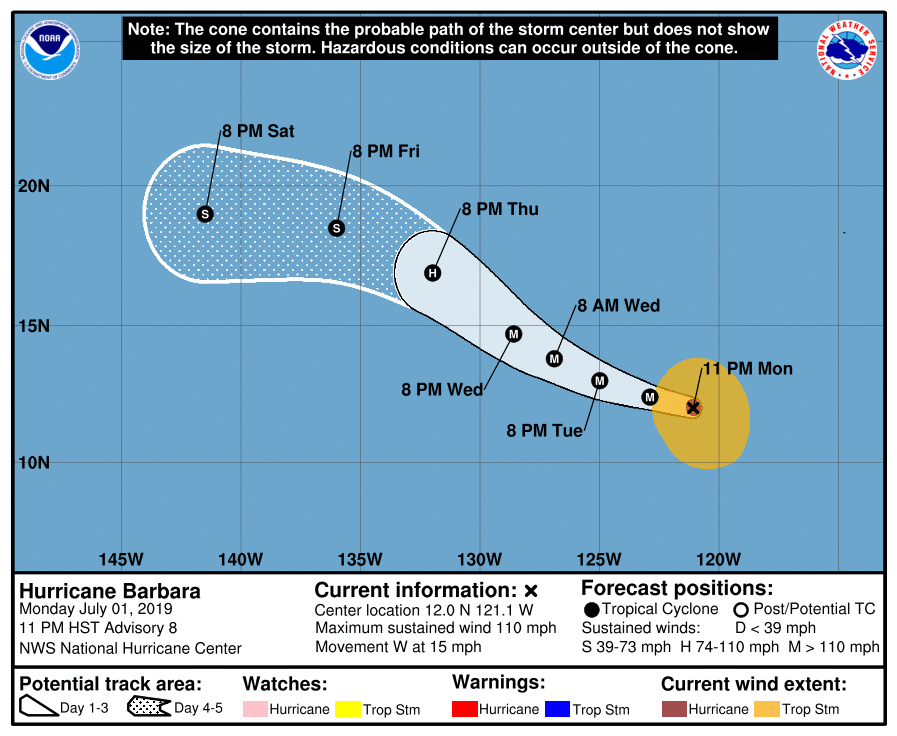
Not so in the Pacific, as a tropical storm that formed off the coast of Mexico has strengthened into a hurricane. Forecasters initially reported Hurricane Barbara as a Category 2 storm that was expected to strengthen over the course of the next 24 hours, but were surprised when the storm quickly moved to Category 4 strength. "Satellite images show that Barbara has continued to strengthen faster than previously indicated and the maximum winds have reached 130 mph (215 km/h) with higher gusts," said forcasters at the National Hurricane Center. At 1100 PM HST (0900 UTC), July 2nd, 2019, the center of Hurricane Barbara was located near latitude 12.0 North, longitude 121.1 West. Barbara is moving toward the west near 15 mph (24 km/h). A turn toward the west-northwest with a decrease in forward speed is expected to begin on Tuesday and continue into Wednesday, followed by a turn toward the northwest on Thursday.
The storm poses no threat to the mainland U.S., but interests in Hawaii should monitor the progress of the storm.
Will it rain on your parade? Where the climate record says it's likely to rain on Fourth of July
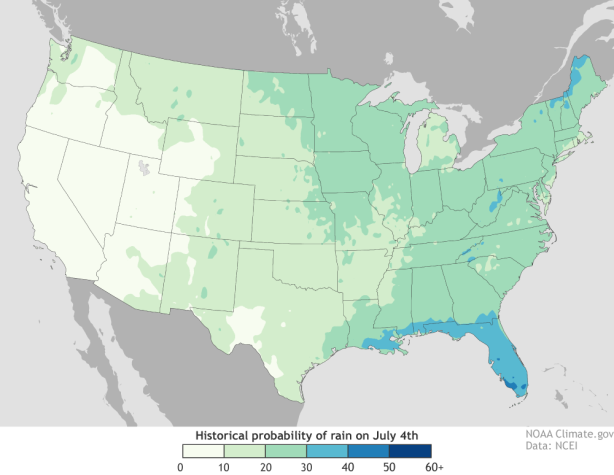
NOAA’s National Weather Service will soon be issuing forecasts for Independence, but here’s a look at the historical probability that your Fourth of July picnic will be rained on, based on observations from 1981-2010.
Fourth of July - Will it rain on your parade?
If all we had to go on was history, this map (Figure 2 above) says the best chances of clear skies in the contiguous United States (CONUS) would be found, not surprisingly, in the West. Based on past Fourths of July, chances for rain are 10 percent or less for a large area from interior Washington to northwest New Mexico. In the CONUS, the highest chances for rain on your parade would be in southern Florida (40-50%), followed by the highest elevations of the Appalachian Mountains in North Carolina and West Virginia, and the Northeastern border with Canada, where chances of rain on July 4th have been 30-40 percent. These places reflect locations with, historically, the combination of abundant available moist air and ways to lift that moist air, in the form of mountains or strong daytime heating.
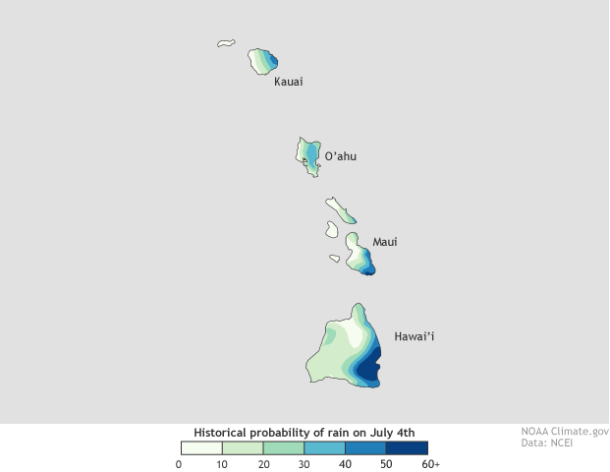
But the highest probability of rain on Fourth of July for any U.S. state is in Hawaii, where the eastern slopes have a 50 percent chance or more of precipitation that day. On the lee side of the islands, however, the chances for rain drop to 10 percent or less (See Figure 3 below).
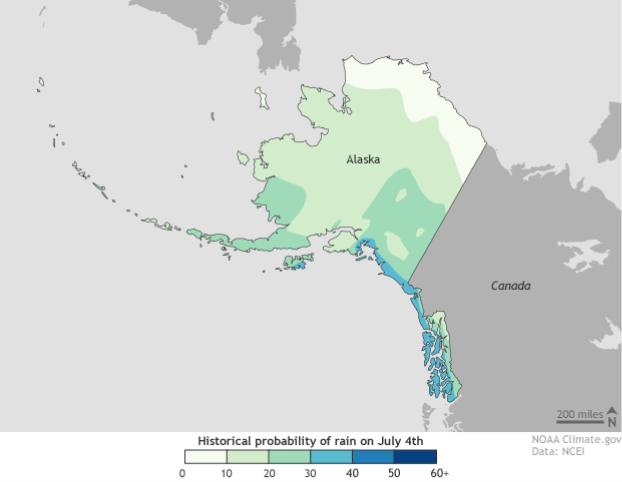
Alaska has also historically had a widespread in the chance of rain on July 4th, with chances on the North Slope of 10 percent or less and chances in coastal, Southeast Alaska of between 30-40 percent as seen in Figure 4 below:
Maps background information:
These kinds of historical-chances maps—the historical chance of a white Christmas; the chance of a Pennsylvania rodent seeing his shadow, and so on—are based on the nation’s “normals.” Normals are calculated every ten years at NOAA’s National Centers for Environmental Information. These are the same normals that your weather forecaster is talking about when she or he says “today was 4 degrees above normal.”
These maps are based on the historical likelihood that at least one-tenth inch of rain will occur. Why one-tenth inch? Because that’s plenty to drench your crepe paper float, make your hot dog buns soggy, or drown out your fireworks. If you’re interested, there are also chances calculated for a hundredth of an inch, a half-inch or an inch.
If you’re planning for an event that’s within 7-10 days, use the forecast. Forecasters track patterns that will move the chance of precipitation for a specific, upcoming day up or down from the historical norm. However, if you’re planning for next year’s July 4th, or any event beyond a dozen or so days, normals are a great way to gauge things.
Climatologically speaking, July 4th isn’t all that different from July 3rd, or 6th, or even June 30th, for that matter. These normals capture a range of dates surrounding July 4th to help broaden the sample for a specific date. This has the effect of smoothing out some of the “noise” that would be associated with only focusing on a single, specific date.
Weekly Outlook:
Here is what to expect regarding precipitation and temperature in the coming week.
Figures 5 and 6 below show the expected 6-10-day temperature and precipitation outlooks. The colored shading on the map indicates the degree of confidence the forecaster has in the category indicated, where "B" and blue colors indicate "below-normal" and "A" and orange-red colors indicate "above normal". The darker the shading, the greater is the level of confidence. The numbers labeling the contours separating different shades gives the probability that the indicated category (A, B, or N) will occur.
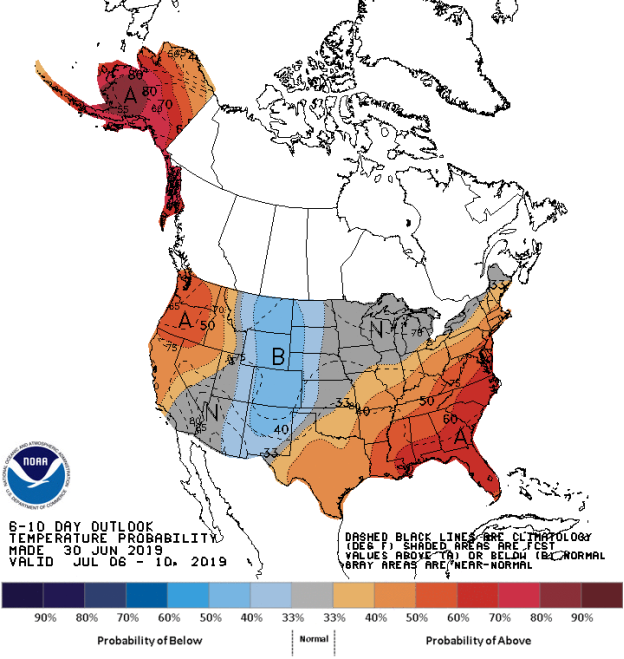
Generally, the probability of below average temperatures (as seen in Figure 5) is moderate over much of the western areas of the Plains states from Montana southwards to New Mexico. In general, the probability is moderate to high that Alaska, the Pacific Northwest, northern California, and the southern areas of the Gulf States and Florida, as well as the entire eastern third of the country northwards into southern New England, will experience above average temperatures. Most of the Midwest, southern California, western Arizona and the northern Plains states will experience normal temperature for this time of the year.
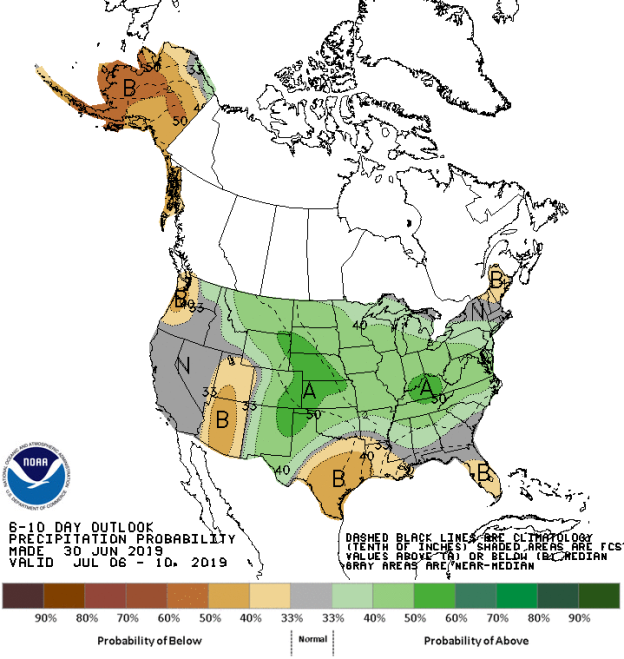
The precipitation outlook for the next 6-10 days (Figure 6) shows the probabilities are low to moderate for below average rainfall over most of Alaska, the Pacific Northwest, Arizona and Utah, southern Texas, southern Florida and far northern New England. The highest probabilities for above average rainfall exist over the western areas of the Plains States (especially, Kansas and Nebraska) and much of the remaining areas of the USA. California, most of Oregon, Nevada, southern areas of New England and northern Florida and southern Georgia should experience average rainfall for this time of the year.
Weekly hazards output by the NWS’s Climate prediction center for the next 3-7 days is shown in Figure 7 below.
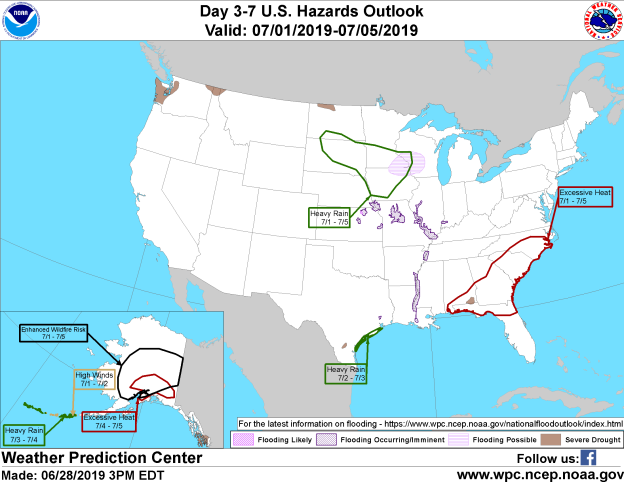
Figure 7 shows that most of the expected weather hazards over the United States for the upcoming week.
Heavy rain is expected over:
- Texas central coast between the 2nd and 3rd July;
- Much of eastern South Dakota, southern Minnesota and western Iowa and parts of far western Wisconsin between the 1st and 5th July;
- Aleutian Islands between the 3rd and 4th July.
Excessive Heat:
- Much of southeastern coastal areas from northern Florida northwards into North Carolina, including southern Alabama, most of Georgia and South Carolina between the 1st and 5th July;
- Far southern Alaska between the 4th and 5th July.
Enhanced Wildfire Risk:
- Much of the southern half of Alaska, excluding the far western coastal regions between the 1st and 5th July.
High Winds:
- Aleutian Islands between the 1st and 2nd July.
Flooding occurring or imminent:
- The Missouri River region south to Kentucky;
- The Mississippi River from Arkansas south to Louisiana;
- Parts of northeastern Kansas;
- Areas of northern central Missouri.
Flooding possible:
- A large area encompassing the far southeastern region of Minnesota, southwestern Wisconsin and far northeastern Iowa.