Harvey: The modern American Natural Disaster. (Part 2: August 28th – August 31st)
ContactRelief Meteorologist Dr. Kevin Levey examines Hurricane Harvey in this 2nd installment of a 2 part series that every risk manager and contact center professional should read.
Tuesday, 12 September 2017 09:00:00 -05:00
Read part 1 of this series here.
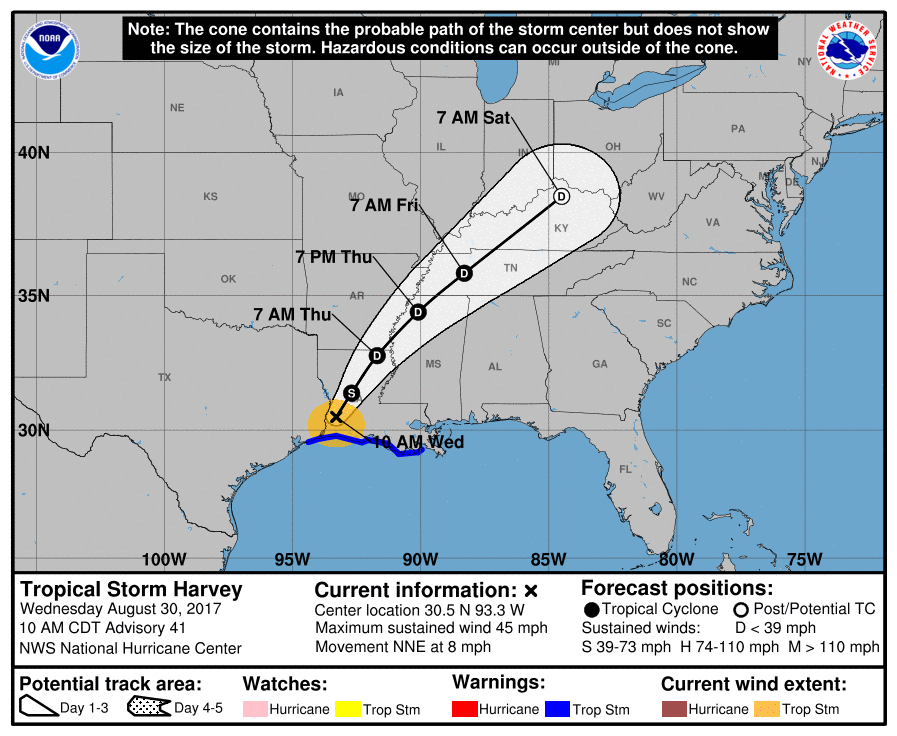
This post continues the discussion of Harvey where my previous post ended off. As of late Wednesday, 30th August, Tropical Storm Harvey had been downgraded to a tropical depression with sustained winds of about 35mph. The last National Hurricane Center (NHC) advisory was issued late on Wednesday night stating that the remnants of Harvey were moving towards the northeast at about 9mph. Figure 1 below shows the last forecast track issued for Harvey by the NHC at 10 AM CDT on Wednesday 30th August. Thus, Harvey lasted from August 17th through August 30th.
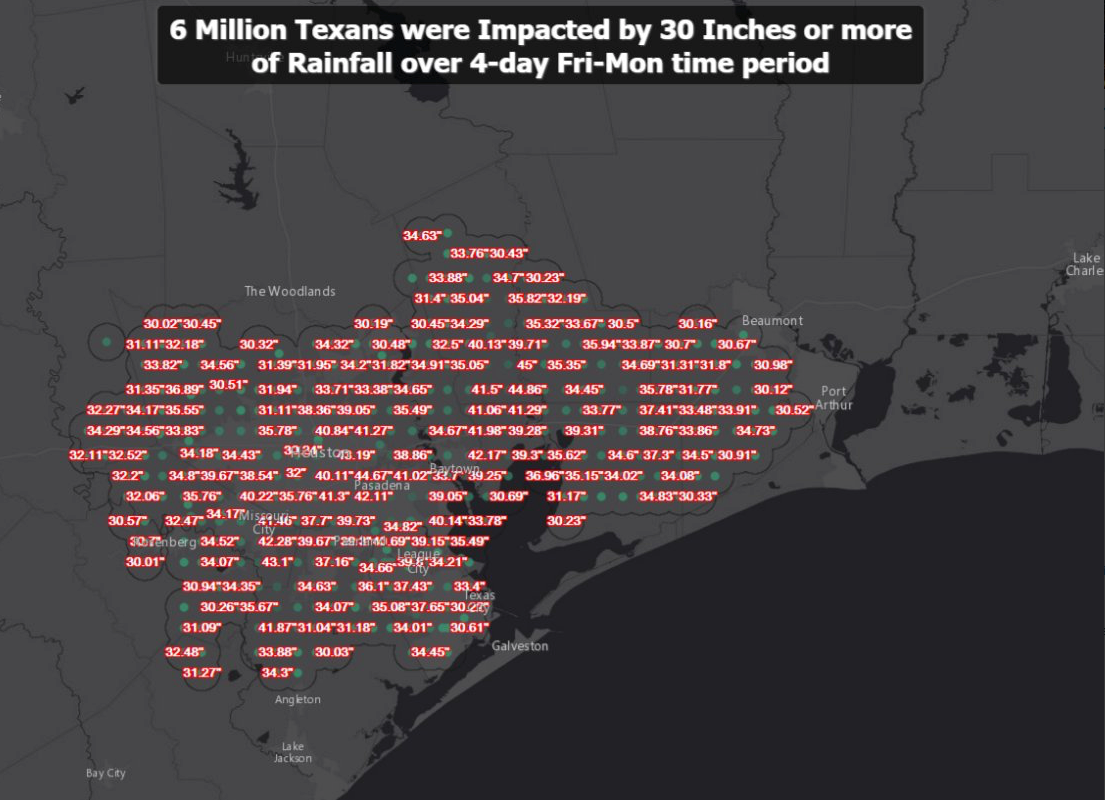
As of Thursday morning, 31st August, at least 31 people had lost their lives, including a family of 6 when their vehicle was swept away by flood waters in Houston. Initial damage estimates are putting the cost of Hurricane Harvey at more than Katrina and Sandy combined, close to $200 billion (per AccuWeather). The lives of over 6 million Americans were affected directly by Harvey. Figure 3 below shows how over 6 million people living in southeastern Texas received over 30” of rain by Tuesday 29th August.
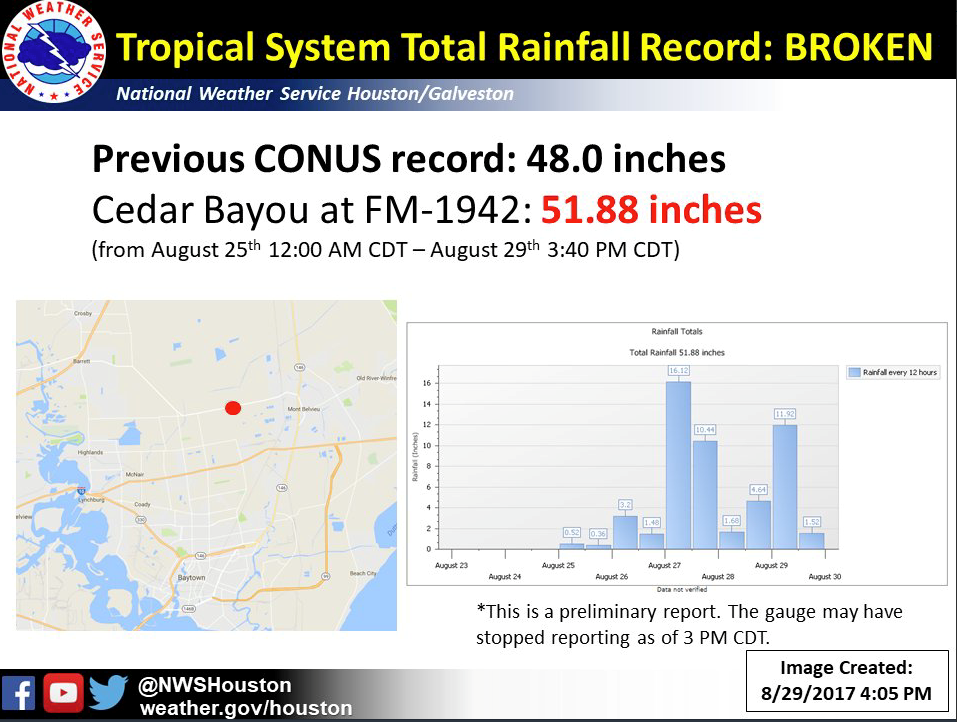
Harvey also broke countless records, but the most staggering record (which was widely anticipated and forecast) was the incredible total storm total of 51.88” or 4.3 FEET of rain that was observed at Cedar Bayou which is located about 30 miles to the east-northeast of downtown Houston. Figure 4 shows the 12-hourly accumulated rainfall for the duration of Harvey. This total breaks the previous continental US (CONUS) record by almost 4 inches and is the highest total storm total ever recorded in the United States. However, to put even this staggering rainfall into perspective, the highest ever 4-day rainfall record belongs to La Reunion Island in the Indian Ocean, where a mind-blowing 194.33” or SIXTEEN FEET of rain was measured during Tropical Cyclone Gamede in February of 2007.
The very high rainfall totals were quite widespread as shown in Figure 5. A very large area received well over 40” of rain. Many rivers and creeks were at major flood stage, some the highest ever recorded.
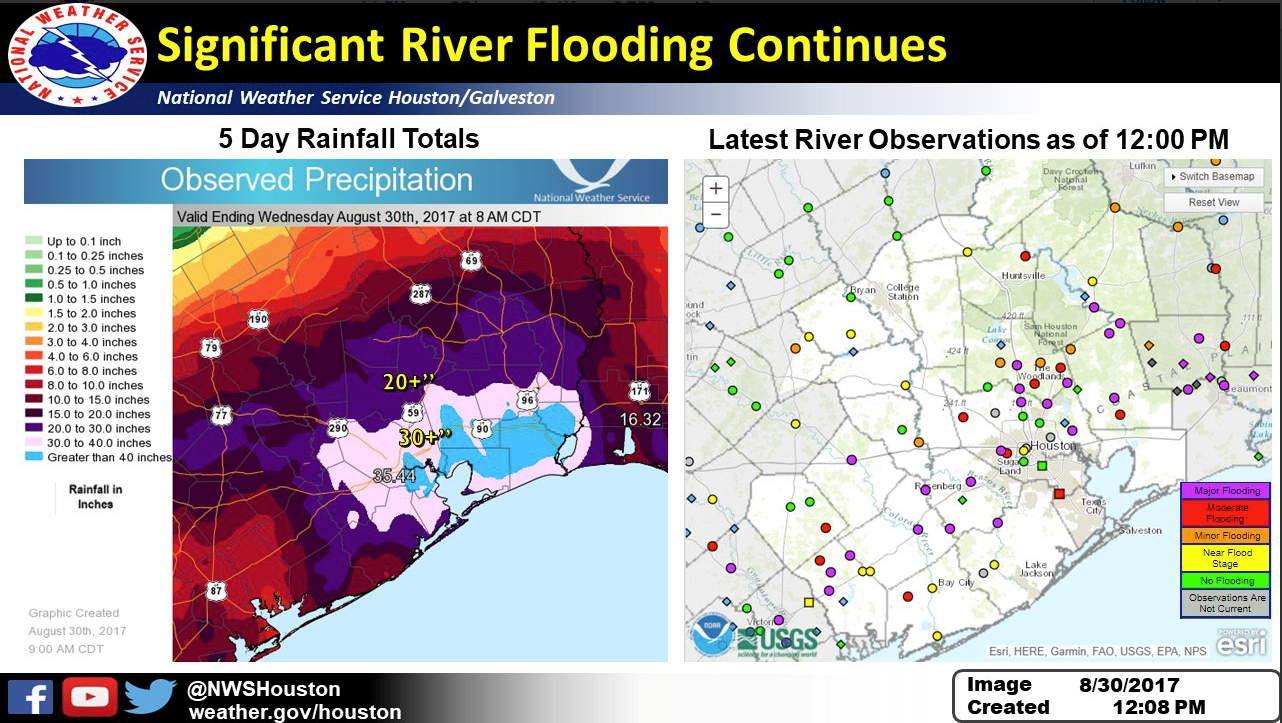
Figure 6 below shows the flooding occurring downstream of the Lake Houston spillway on Wednesday 30th August. Over 375,000 CFS was going over the spillway at the time.
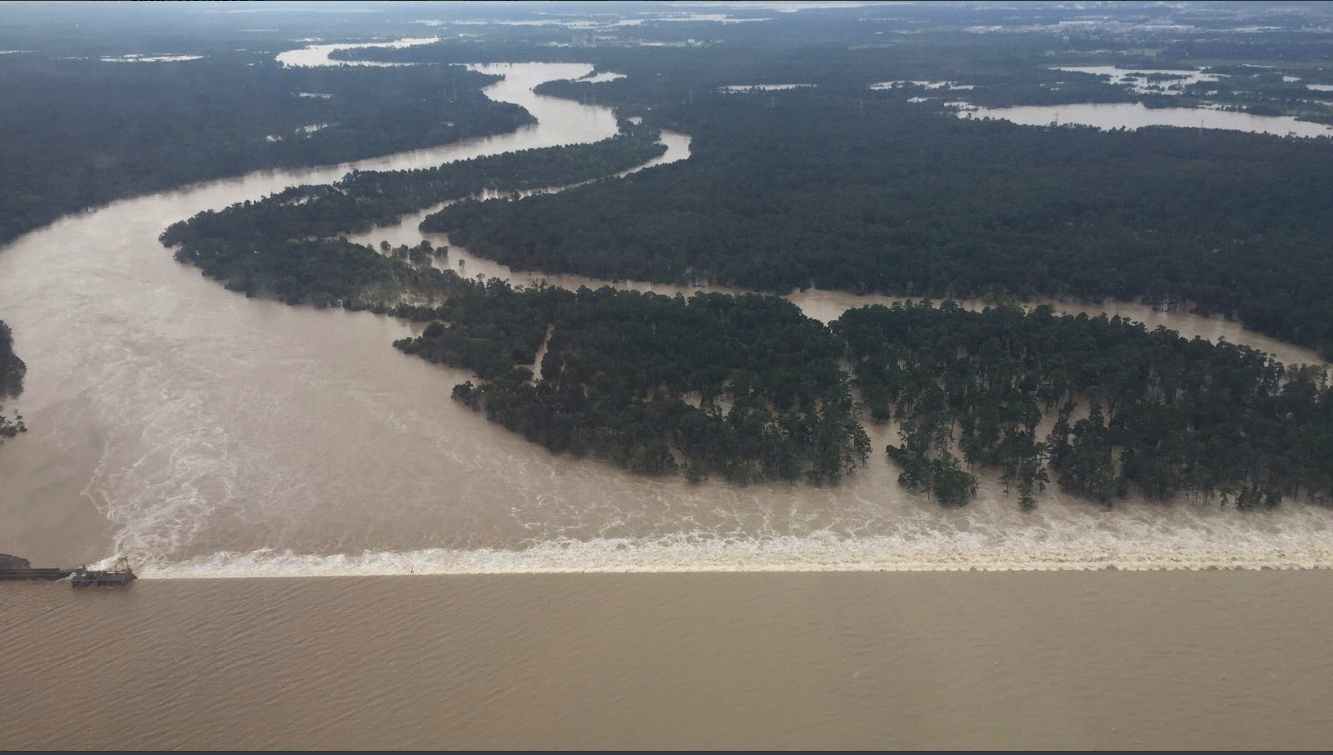
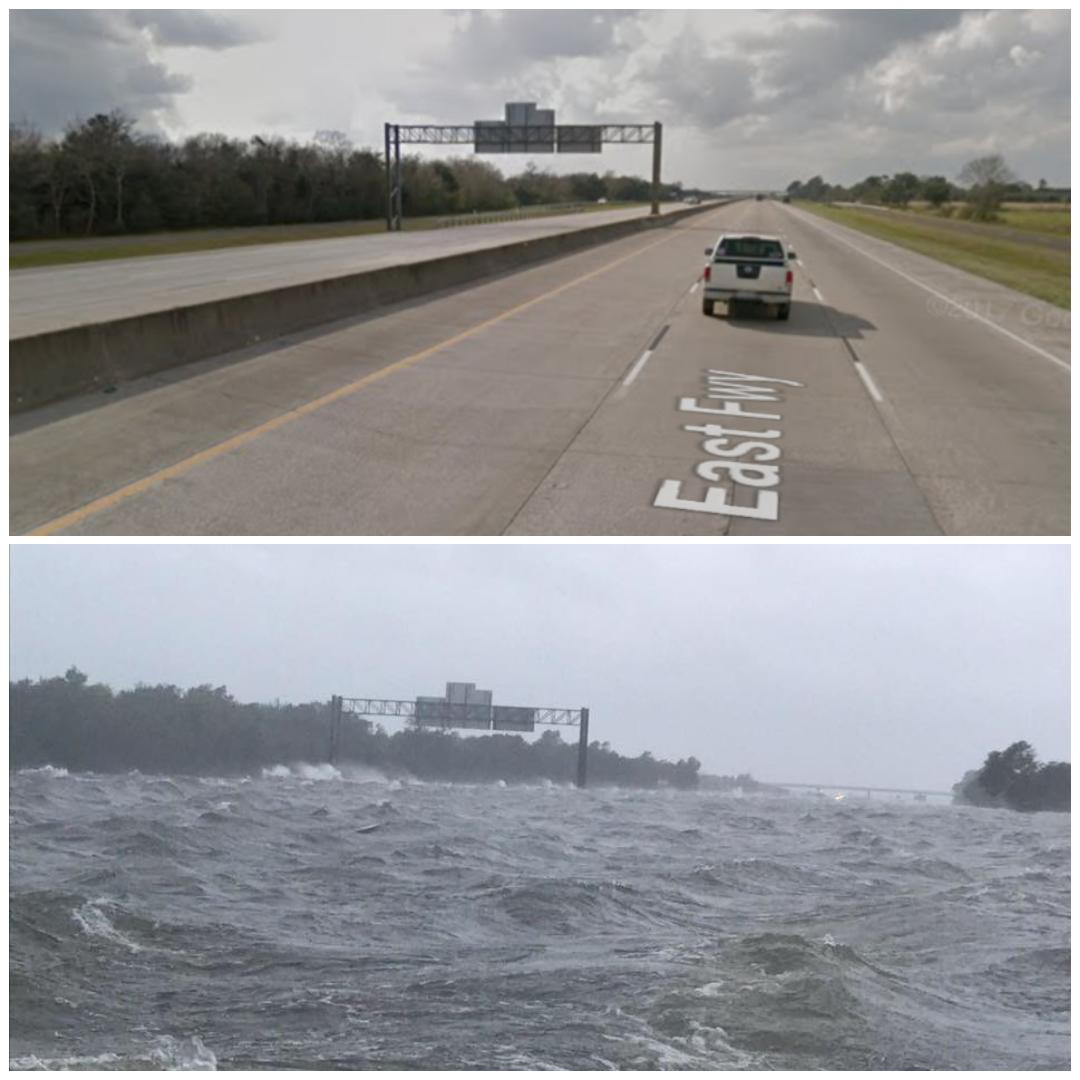
Lake Houston Spillway as of Wednesday 30th August. (Courtesy: Harris County Flood Control District) As Tropical Storm made its second landfall on the Texas-Louisiana border near Port Arthur, I-10 was swamped by floodwaters and storm surge. Catastrophic flooding occurred in this area as Harvey came ashore for the second time. Figure 7 below shows the before and after photos of I-10. One of the largest oil refineries in the US, the 600,000 barrels per day Saudi Aramco-Motiva facility in Port Arthur, Texas, had to be shut down as did many other oil refineries around the Gulf of Mexico. Inevitably, there were short term rises in the gasoline prices which persist even today.
As of Thursday, 31st August, the remnants of Harvey are on track to move northeastwards into the Ohio Valley by early Saturday.
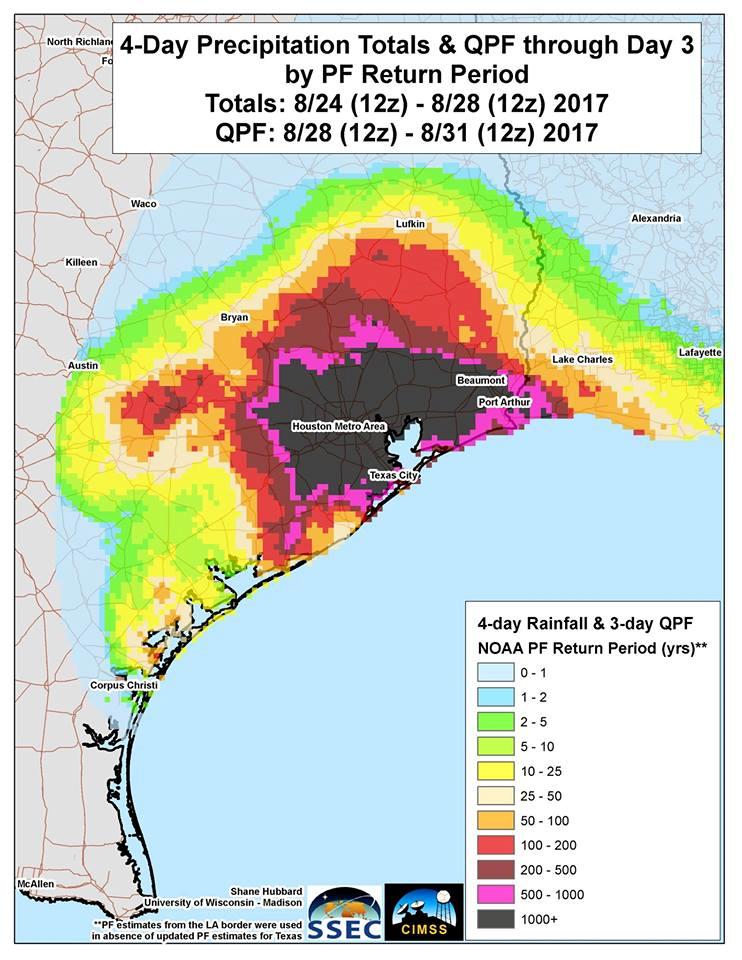
A question posed to me by one of my students was whether a major hurricane like this could occur again. After only 2 days, areas of Houston and Harris County had already exceeded a 500-year event per the USGS [Note: a 500-year event means in any given year there's a 1:500 chance of occurrence.] However, by Monday the 28th, the 4-day precipitation totals were quickly adding up and with the forecast of another 10-15” from Monday to Tuesday, the projection was that the Houston metro area would be facing a likely 1000-year event as shown in Figure 8 below.
Statistically speaking, therefore, we should not expect another event like this in at least 1000 years. However, I will remind you that Tropical Storm Allison, which dumped upwards of 35” over the Houston metro area occurred back in 2001, only 16 years ago. The chances of another natural disaster like this occurring in the near future are frighteningly real, according to Penn State Professor, Michael Mann.
He states that “There are certain climate change-related factors that we can, with great confidence, say worsened the flooding. “. He mentions that there has been at least half a foot of sea-level rise in the northern Gulf of Mexico. The implication of this is that the storm surge was about half a foot higher than it would have been just a decade ago. Sea-surface temperatures have also risen in the area close to 1°F from roughly 86°F to 87°F. On top of that, sea-surface temperatures in the Gulf of Mexico have been about 1°-2°F higher than normal, resulting in very warm sea-surface temperatures. This may explain the rapid intensification of Harvey from a cluster of disorganized thunderstorms into a major category 4 hurricane in less than 48-hours. Another side effect of the very high sea-surface temperatures is that for every degree of warming of the ocean surface, you roughly increase the atmospheric moisture content by about 3%, so together with the above average sea-surface temperatures of about 1°F and the rise in sea-surface temperatures of about 1°F over the last decade, there was about 3-6% more available moisture content in the atmosphere. This in turn leads to the potential for much larger rainfall totals and greater flooding. So, the combination of coastal flooding and the very heavy rainfall was essentially responsible for the devastating flooding that occurred in the Houston area.
Another major factor in this disaster was the absence of upper-level steering currents that are associated with the jet-stream in the upper atmosphere. This resulted in Harvey meandering over the same areas for at least 2-3 days. Studies have shown that, over the last few decades, the subtropical high pressure system has expanded northwards over the USA during summer months, pushing the jet-stream further northwards and hence the steering mechanisms that usually move dissipating hurricanes or tropical storms towards the north and northeast and fairly rapidly away from harm’s way.
All these factors do not bode well for the future. Tropical storms have been predicted for years to become stronger and more intense under a warming climate. Harvey certainly has been a wakeup call. Will we see another event like this in our lifetimes? I think we have a better chance of saying yes, then winning the next Powerball lottery.
Unfortunately, Hurricane Harvey was not the last hurricane of the season as Hurricane Irma cut a broad zone of destruction through Florida and left many millions without power. The hurricane season is near its maximum. Stay tuned to ContactRelief's Weather Insights series for more important information that every risk manager and contact center professional should know!